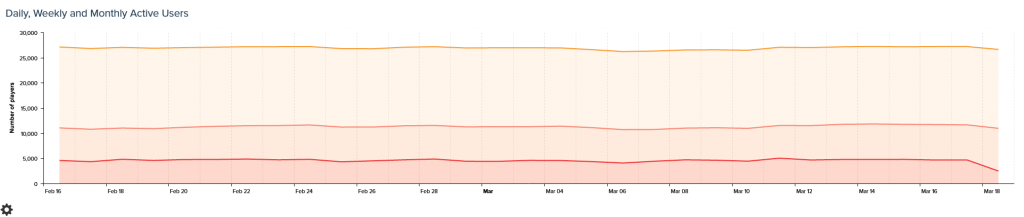
The Daily Active Users (DAU) gives the total number of unique users playing the game in the last day. This is the best measure of which players are actively and currently engaged with the game. There may be a small number of returning players who are active but not played the game in the last day but this is one of the best measures of all active players.
The Weekly Active Users (WAU) gives the total number of unique users playing the game in the last seven days. Some of these players may not return to the game so the WAU does not give an accurate measure of currently engaged players but it does allow the measurement of increases and decreases in the player base.
The Monthly Active Users (MAU) gives those players who have been active in the game in the last thirty days. Many of these players may not be currently active and this should be borne in mind when presenting this figure.
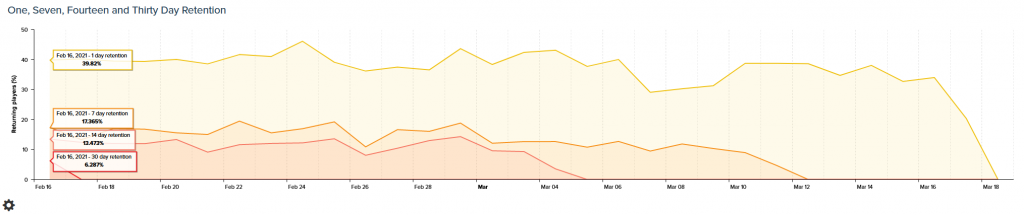
This chart shows the percentage of players that are still playing after one, seven, fourteen and thirty days. The retention is calculated by looking at players that played on a day and then exactly one, seven, fourteen and thirty days later.
A steady retention rate like the chart above gives a good indication of a game that is retaining users. The closer the 30 day retention is to the 1 day retention, the better your overall retention rate is in the game.
Sessions
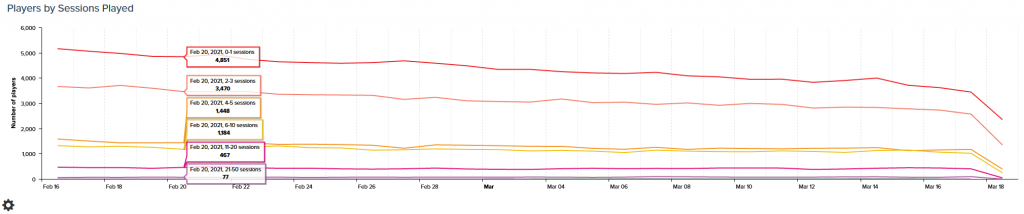
Players By Sessions Played shows the unique players on each day split by the number of sessions they have played. The number of sessions is banded into groups and represents a range of sessions.
The example above shows largest group of players that have only played 1 session, these are players who may have lost interest in the game very quickly. The smallest group have played between 21 and 50 sessions. These players are quite engage and seem to return to the game quite often.
Each of these player groups represents part of a different segment of the playing base. As each group changes over time you can see how the playing base is maturing from a fairly new set of users to a more engaged group of users.
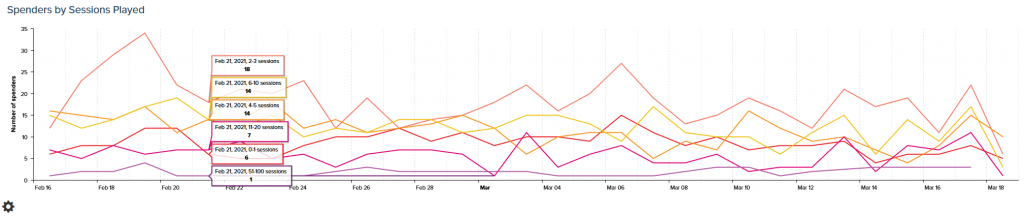
Spenders by Sessions Played are the number of daily unique paying players split by the number of sessions they have played.
The majority of the payers are those players that have played for between 2 and 3 sessions, this suggests that there are successful initial campaigns which encourage player to spend. As the number of active spenders in groups which have a larger number of play sessions increase then the active spenders in groups with lower numbers of play sessions decrease.
The game is successful at converting early spenders and does not focus on later spenders over the period of this chart.
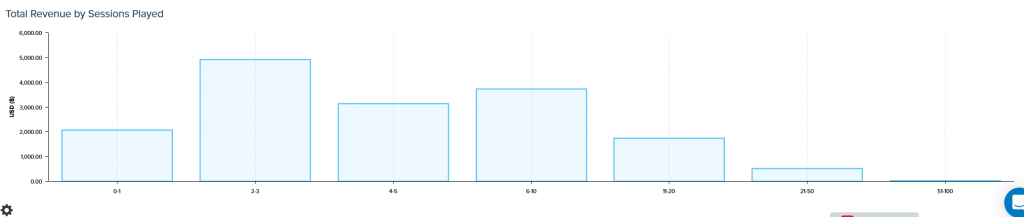
Total Revenue by Sessions Played is the total revenue split by the number of sessions players have played. This shows how much of the revenue is being generated by the player groups. In this example, the early spenders a vital to generating revenue.
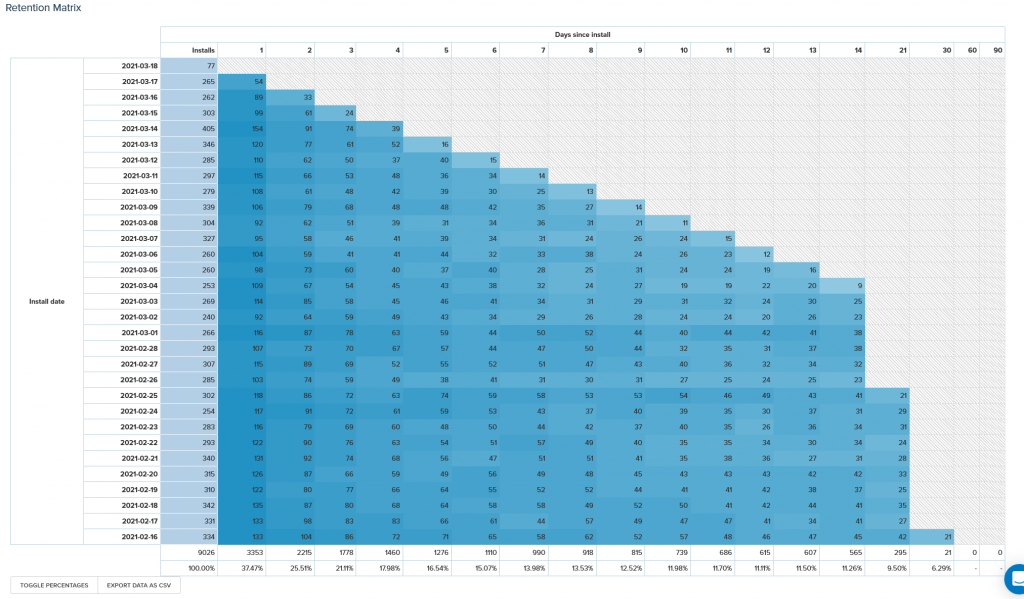
All Player Retention Matrix
The All Player Retention Matrix tracks how often players are coming back and playing. It includes players based on the filters at the top of the page and counts relative to the first Day in the matrix. Therefore it may include new players, returning players or a mixture of both, depending on how you filter the matrix. It will show you how many players have played for a certain number of days across the game’s lifespan. These days do not need to be in a row, it could be across a large period (or the whole lifespan of the game).
New Player Retention Matrix