Overview
The Slice & Dice tool allows users to dig much deeper into the data from their game, finding insights that will allow you to improve the retention and monetisation and address questions such as:
- Is the mission difficulty correctly balanced?
- What items are being sold?
- How much virtual currency is being consumed?
This tool runs against your game data and is subject to any data retention policies on your game. You can access any of the events and parameters sent from your game and use them to build custom tables and charts.
Query Management
The toolbar at the top of the page provides functions to manage your Slice & Dice queries. You can create new queries and name them. Your queries can be saved and loaded again at a later date and you can export the results of your query as a JPG, PDF or SQL. Exported SQL can be used in Direct Access to run the query from your preferred SQL management tool. On the far left of the toolbar is a Run button which will execute your query.
![]()
Query Results
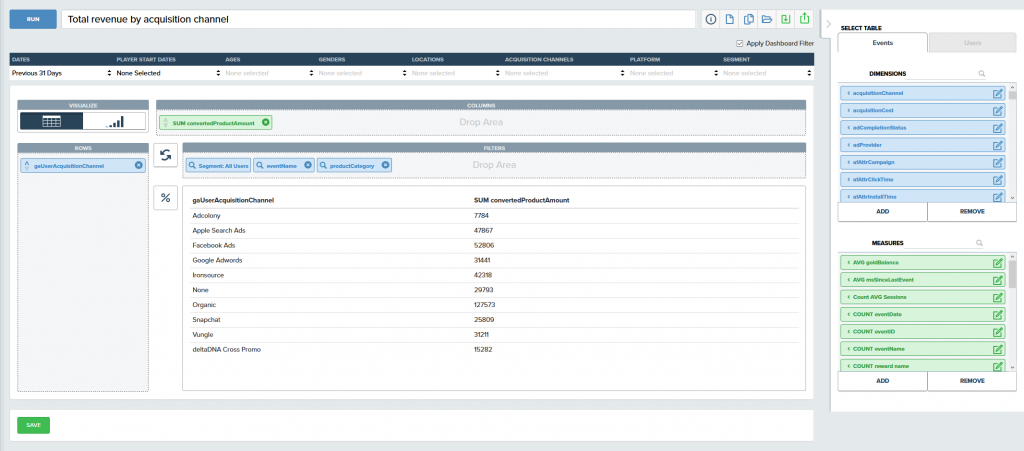
The results of your query will be displayed in the central panel as either a table or a chart.
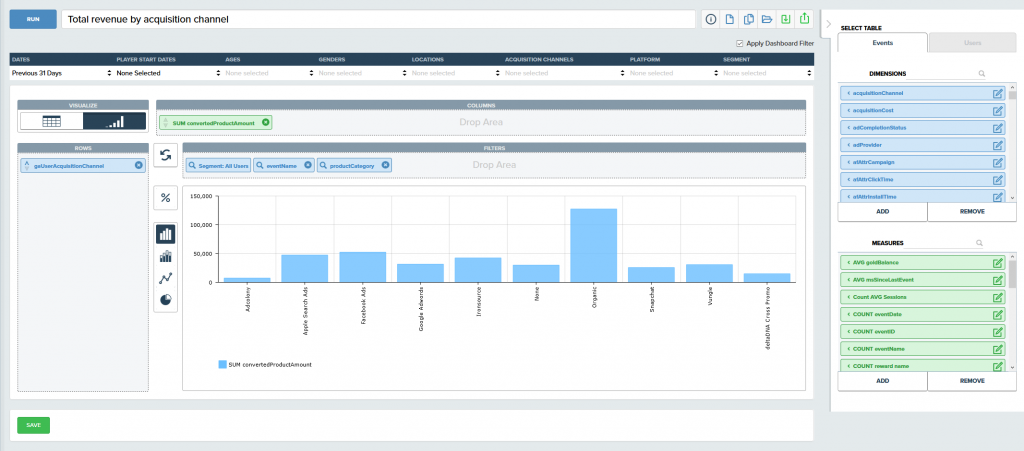
You can toggle between table and chart displays and choose the type of chart.
You can maximize your query results area by sliding the “Navigation” and “Dimensions & Measures” panels out of view using the controls highlighted below.
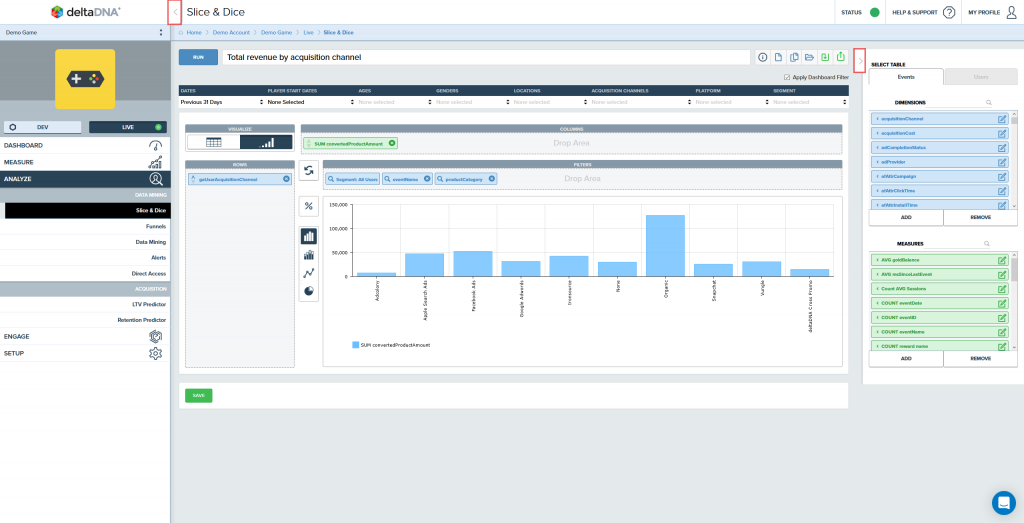
Building Queries
Queries are built by choosing the dimensions and measures you want to analyse and dragging and dropping them in to the rows, columns and filters panels.
Measures and dimensions that have been added to the Rows or Columns panels can be removed by clicking on their close icon ![]() . Clicking on the vertical arrows to sort your query results on in ascending or descending order. When you place a measure or dimension in to the filters panel you can click on their magnifying glass icon
. Clicking on the vertical arrows to sort your query results on in ascending or descending order. When you place a measure or dimension in to the filters panel you can click on their magnifying glass icon ![]() to select what values you wish to filter on. If you get your rows and columns reversed you can use the swap button
to select what values you wish to filter on. If you get your rows and columns reversed you can use the swap button  to swap their axes.
This simple drag and drop interface will let you quickly build simple or complex queries and easily drill into your player behaviours.
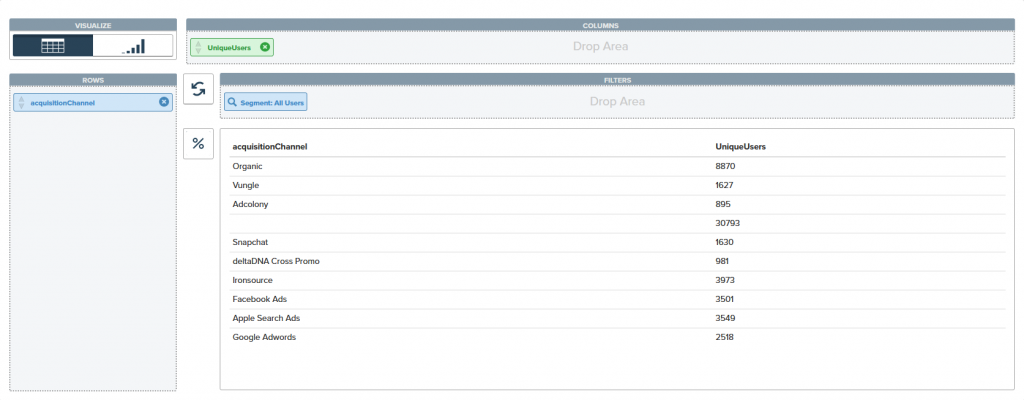
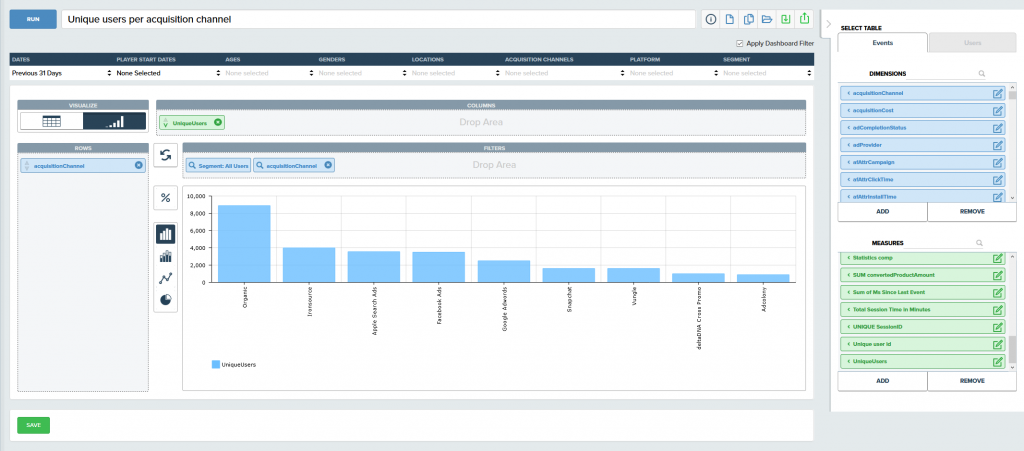
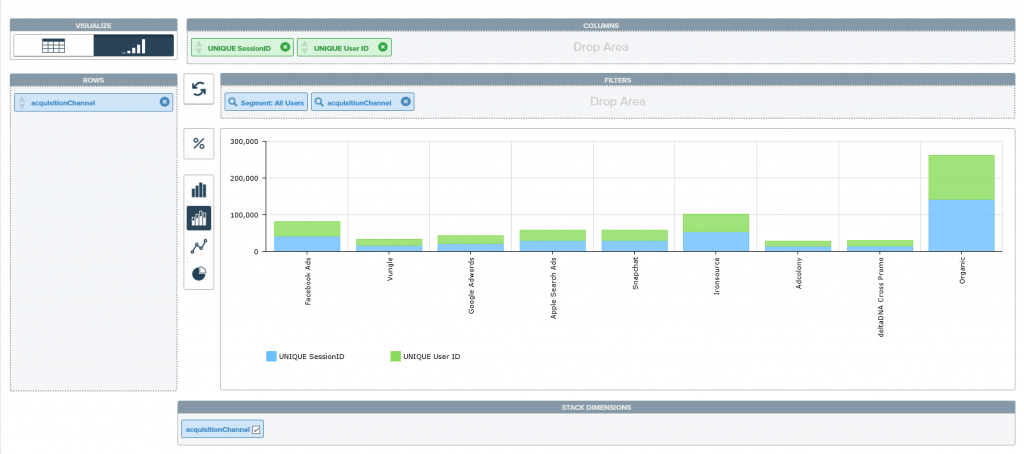
Example – Unique users per acquisition channel
This example demonstates how to see how many unique users have started playing the game from each of our acquisition channels. The data from the demo game shall be used.
- Click on the new query button in the toolbar
- Drag the Unique Users Measure in to the Columns panel
- Drag the Acquisition Channel Dimension in to the Rows panel
- Press the RUN button on the toolbar
You should now be able to see a table showing the number of unique users for each acquisition channel.
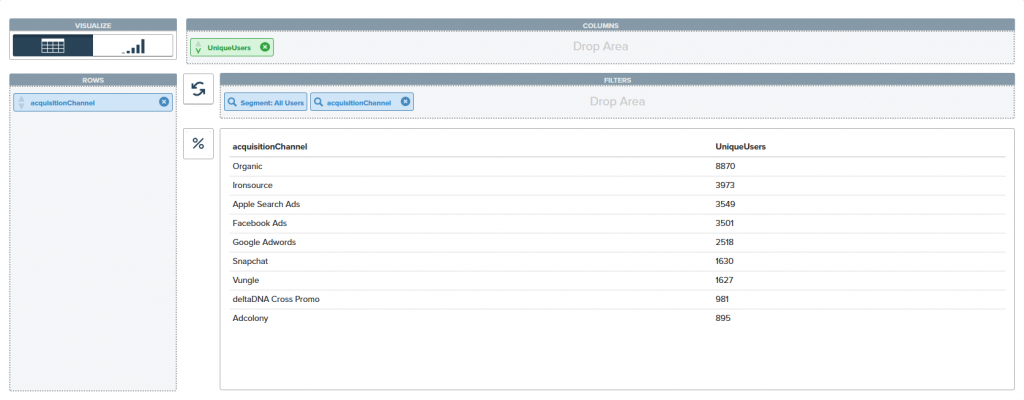
- To tidy up the results, the users with no acquisition channel and the data should be sorted in descending order
- Drag an additional Acquisition Channel Dimension into the Filters panel
- Click on the magnifying glass icon to reveal the filter options
- Click the Add All button to move all acquisition channel dimension values to the “Selected” panel and click OK
Alternatively, you could have single or multi-selected individual values and used the Add button to select just the acquisition channel values you are interested in. - Click the lower sort arrow on the Unique Users measure that you placed in the columns panel to sort the results by the number of Unique Users in descending order.
- Press the RUN button on the toolbar.
Your display should look like the like the image below.
- Click on the Query name label in the toolbar and give your query a meaningful name.
- Press the SAVE button on the toolbar to save it
NB – Queries you save are shared between users on your account. - Click the Table/Chart toggle button to view your results as a chart:
Dimensions and Measures
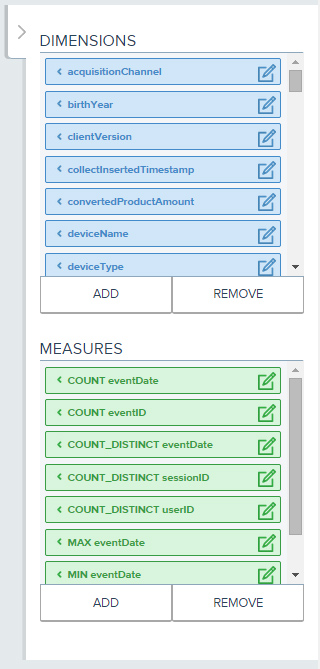
Dimensions
There are 3 types of dimesion:
- Column Dimensions
The example query, explored above, uses column dimesions. This type of dimesion is the type that will be used the most often. These dimesions contain the value of a database row from a specific Column. These are the names of the parameters which you are tracking. For example, missionName = “First Time User Forest” - Counter Dimensions
A Counter Dimension is used to attach a counter to an event row based on conditions that you define. The counter can then be used as a filter where you can then analyse another columns on the selected event. For example, A “First Time Deposit” counter dimension would put a counter on all transaction events from a user then you could filter your query to look at only the first transaction for each user. - Derived Dimensions
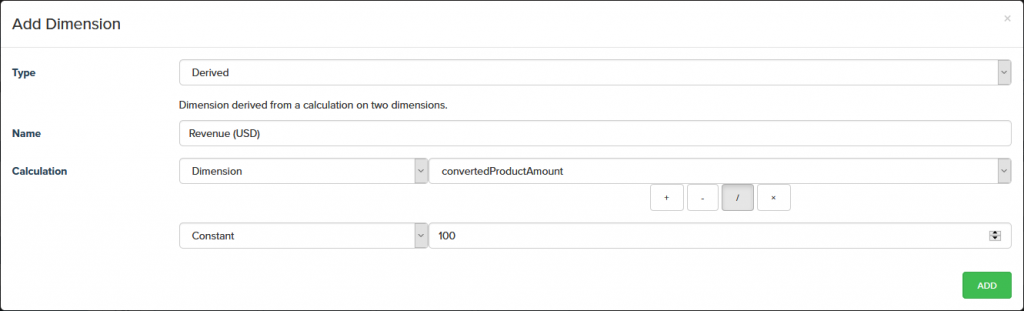
A Derived dimension is used when you want to create a new dimension by aggregating two existing dimensions. For example, Total Time Played / Number of Sessions = Average Session Length.
Measures
Measures are the quantities of a parameter that you want to measure. Measures can be quantified 6 different ways: MIN, MAX, COUNT, UNIQUE, SUM, AVERAGE
Managing dimensions and measures
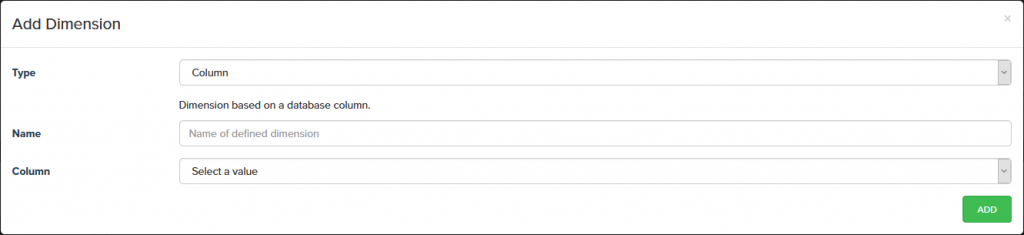
Adding: As you add new events you can add new dimensions and measures to track them in. Click on the ADD button ![]() below the dimension or measure selection list to create a new one. Then select the parameter, give it a friendly name and click Add.
below the dimension or measure selection list to create a new one. Then select the parameter, give it a friendly name and click Add.
Measures can only be added after the corresponding Dimension has been added.
When you are adding a Measure, the aggregate selection list lets you specify how you want the measure to be counted.
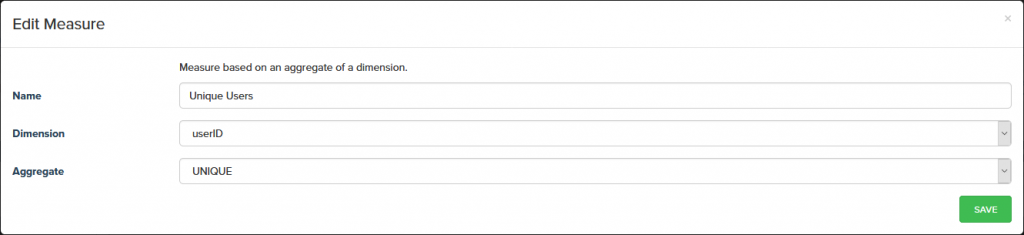
Editing: Clicking on the edit icon ![]() on a dimension or measure will let you alter or rename it.
on a dimension or measure will let you alter or rename it.
Remove : You can remove any Measures or Dimensions that aren’t being used by selecting them and clicking the remove button ![]() found below both the dimension and measure selection lists.
found below both the dimension and measure selection lists.
Counter Dimensions
A counter dimension allows you to attach a counter to each event row that meets certain conditions, that you specify. You can then use the counter to select specific rows and use these in your main query. The following example shows how build a query to find the first item that players are purchasing.
-
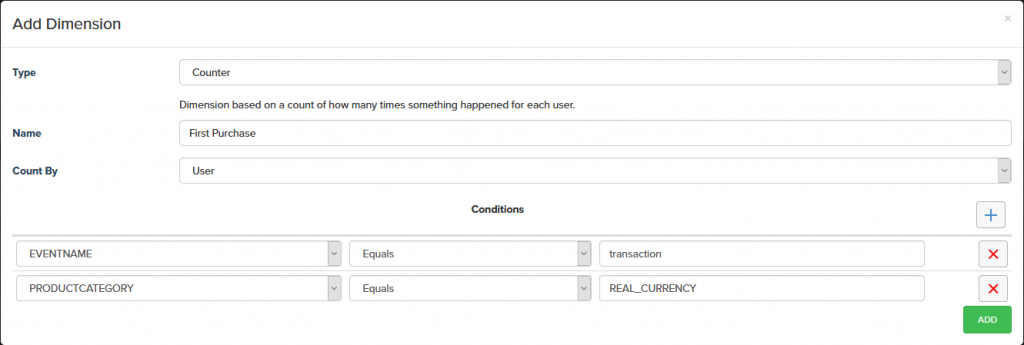
- Create a new dimension by pressing the “Add” button and select “COUNTER” as the type of dimension.
- Give the dimension a name, then add the conditions that will be used as event conditions, then press the green “Add” button to create your counter dimension.
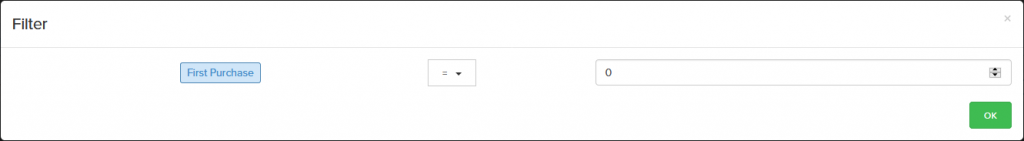
- Drag and drop the counter dimension you just created into the query filter panel.
- Click on the magnifying glass icon and select First Purchase = 0. This will let use query the first purchase for each user.
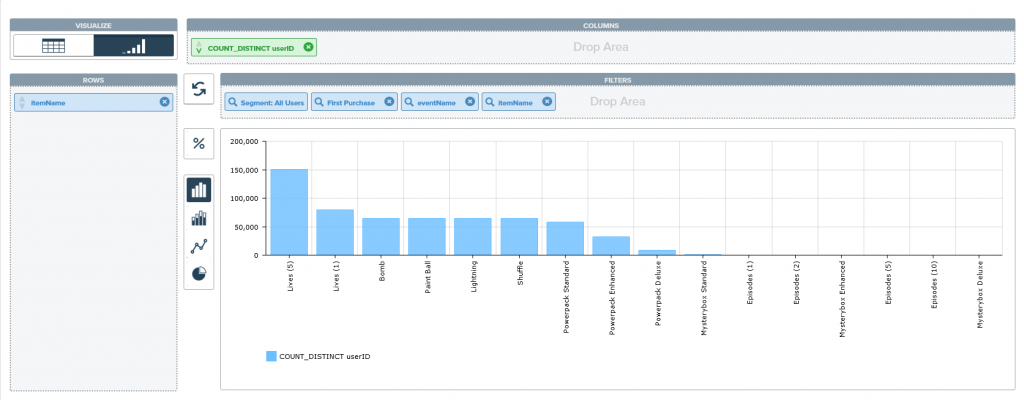
- Add in the columns and rows you wish to query. The example below looks at the number of unique users purchasing each item. It is filtered such that only transaction events are looked at and null results are excluded.
- Finally, run your query.
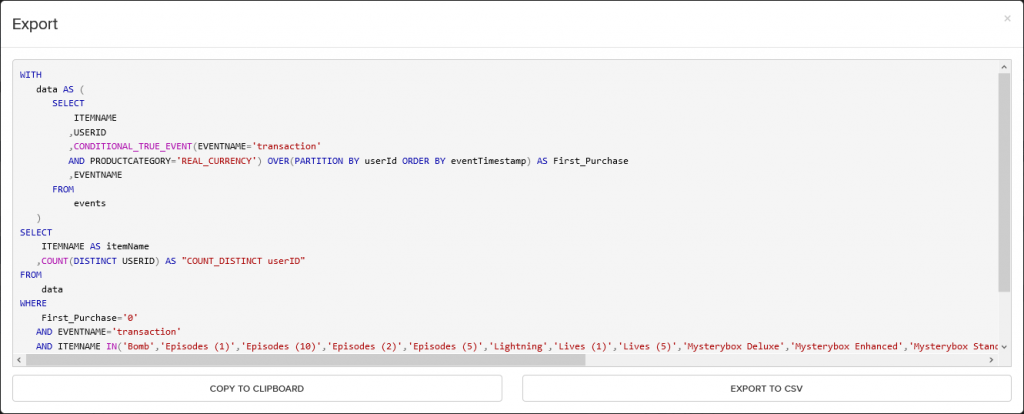
You can export the SQL from your query by clicking the ![]() export button on the toolbar if you want to see how the query was built and use it as the starting point for more sophisticated Direct Access queries.
export button on the toolbar if you want to see how the query was built and use it as the starting point for more sophisticated Direct Access queries.
Derived Measures
It is also possible to create derived measures, calculated from existing measures, constants or other derived measures. Click on the Add button at the bottom of the Measures panel and select DERIVED from the Dimension Type drop down list.
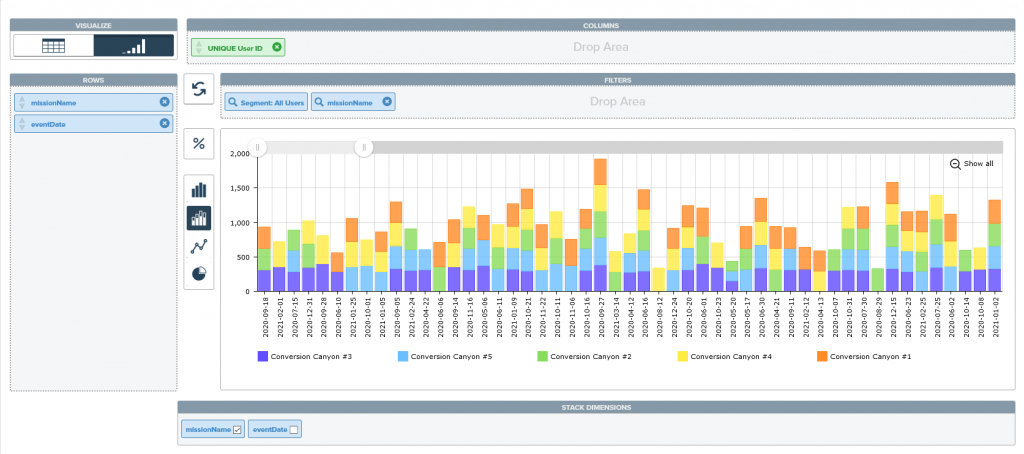
Stacked Charts
Stacked charts can be created by selecting the stacked chart icon ![]() when there is more than one measure in your query.
when there is more than one measure in your query.
It is also possible to create charts that are stacked by dimension however, you need to select which of your dimensions should be stacked by clicking on the relevant dimension in the Stack dimensions panel below the chart area.