

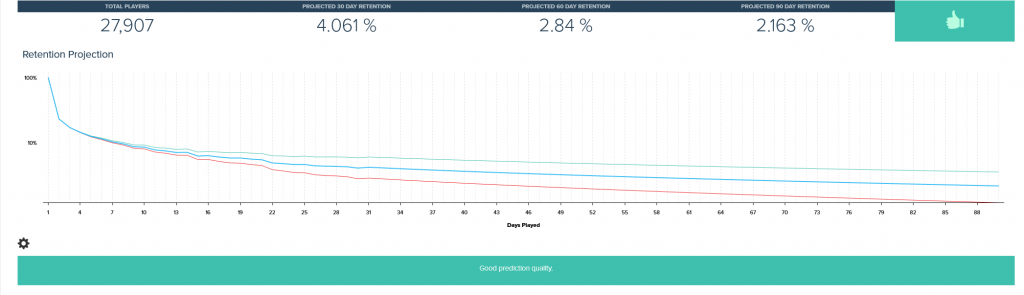
The four values returned by the retention optimizer are:
- Total Players: this is the total number of players that installed between the selected start dates, and satisfy the filter and segment selections
- Projected 30 Day Retention: this is the fraction of the player cohort that will play on Day 30
- Projected 60 Day Retention: this is the fraction of the player cohort that will play on Day 60
- Projected 90 Day Retention: this is the fraction of the player cohort that will play on Day 90
The Retention Projection chart shows the projected retention (i.e. % of players that are playing) at each of the Days Played. The blue line shows the best estimate of the retention, while the green and red lines show the maximum and minimum value, respectively, within which that the retention could fall.
As the retention optimizer works by projecting from actual data observed for a selected cohort, it will fail to give an accurate prediction if the number of player and spenders falls too low. If the total number of players in the selected cohort is less than 100 the prediction will be based on default model parameters. In these cases the tool will produce a warning and the chart will look like this:
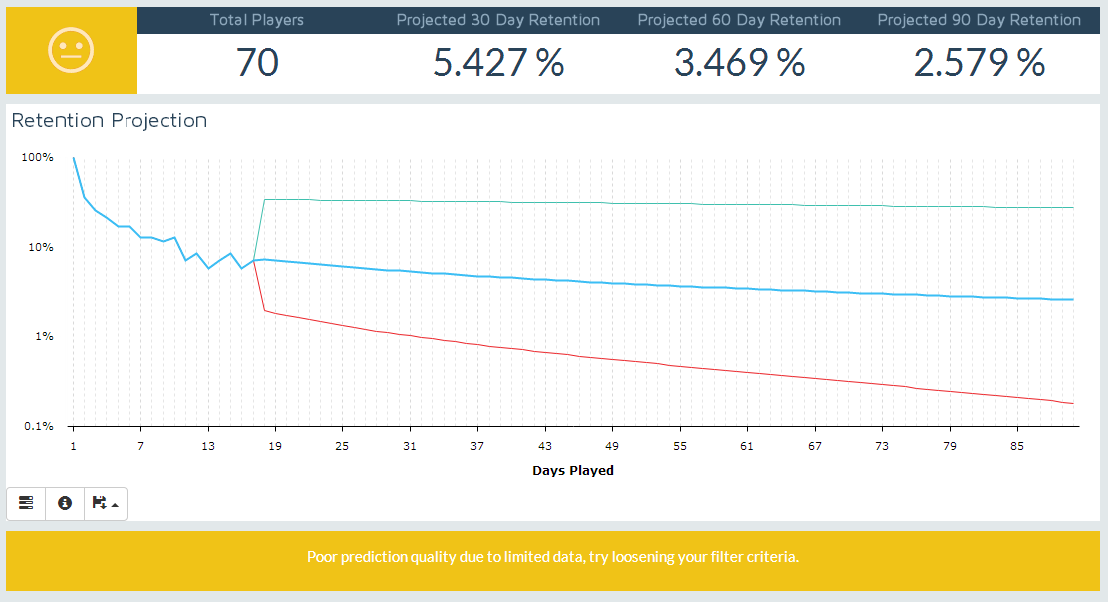
Retention estimates produced in these cases should be treated with caution. If the total number of players falls below 20 the retention optimizer cannot return meaningful results. In these cases the returned predictions should not be used. If the total players is too low the retention optimizer chart will look like this:

The type of retention we report is the classic day N retention based on UTC days. This means a user is considered retained if they play are active on the n-th day after the date of their first event.

