The benchmark dashboard lets you see how the public perceive your game and how it compares to other games based on data aggregated from a wide source of feeds. Your dashboard contains three distinct areas:
Common KPIs – The top section of your benchmark dashboard contains 4 common KPIs and compares your game’s score against other games.
The percentile markers and values will highlight uneven distribution of values. For example, the center section of the one day retention KPI above covers the range from 15-30%, so the 23% scored by the demo game is actually pretty average.
Ratings – The ratings bar shows the relative number of ratings your game has received.
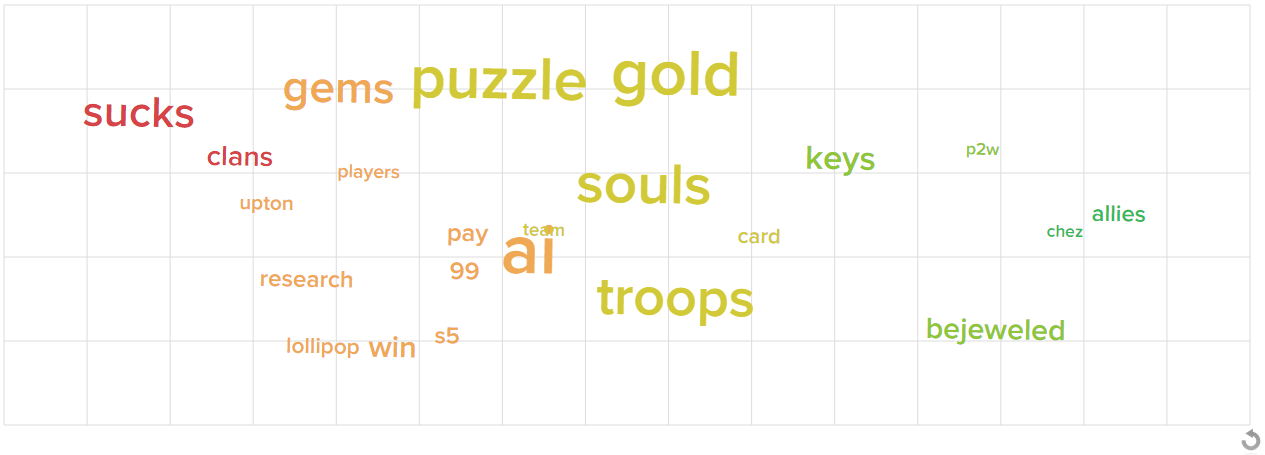
Word Cloud – The Word Cloud lets you see what people are saying about your game. The color of the word corresponds to the number of stars the users who used the word awarded your game.
Configuring your data sources
If your Ratings panel doesn’t populate it probably means your data sources have still to be configured.
1) Use the breadcrumbs at the top of your page to navigate back to your Game Management page.

2) Click on the Edit Game Details button ![]() for your game.
for your game.
3) Click on the Review Sources tab on the Edit page.
4) Add the ID of your game in the Apple, Google or Steam stores. Don’t forget to Save ![]() each source you add.
each source you add.


