Revenue
The Revenue dashboard provides information on the amount of real money that is being spent in the game.
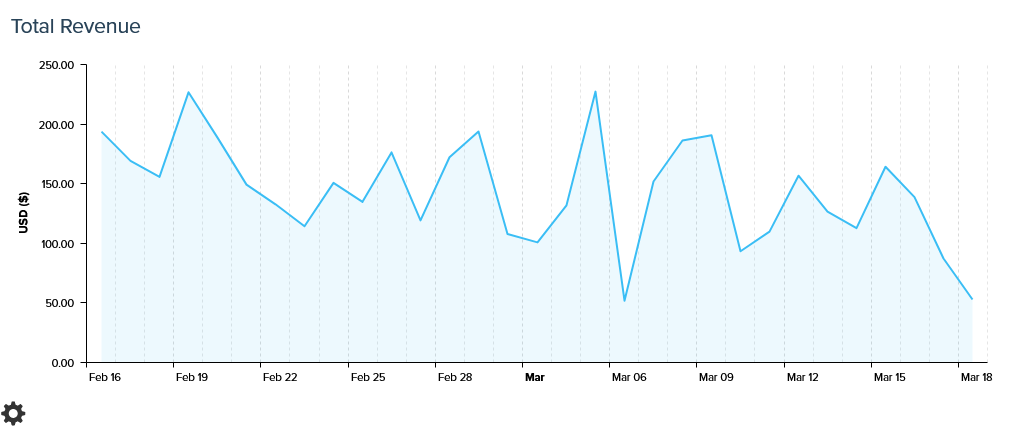
Total Revenue is the total amount of revenue generated each day in US dollars. Revenue is converted from the currency sent by the game into US dollars at the current exchange rate and the amount is prior to any deductions. As this data is converted into dollars on the fly, it is only a guide to the amount of revenue the game is generating. Revenue will generally peak at weekends and around promotions and gives a good indication of the success of a title.
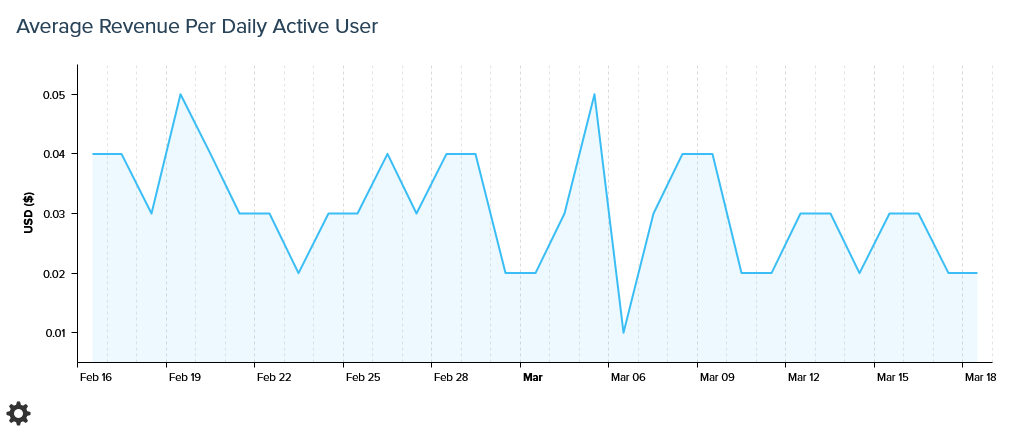
Average Revenue Per Daily Active User is calculated by taking the total daily revenue and dividing by all active players for that day. It gives a measure of the average contribution for all players. However in reality only a small proportion of players will be paying so it is generally more appropriate to focus on increasing the % Paying and the ARPPU as individual activities.
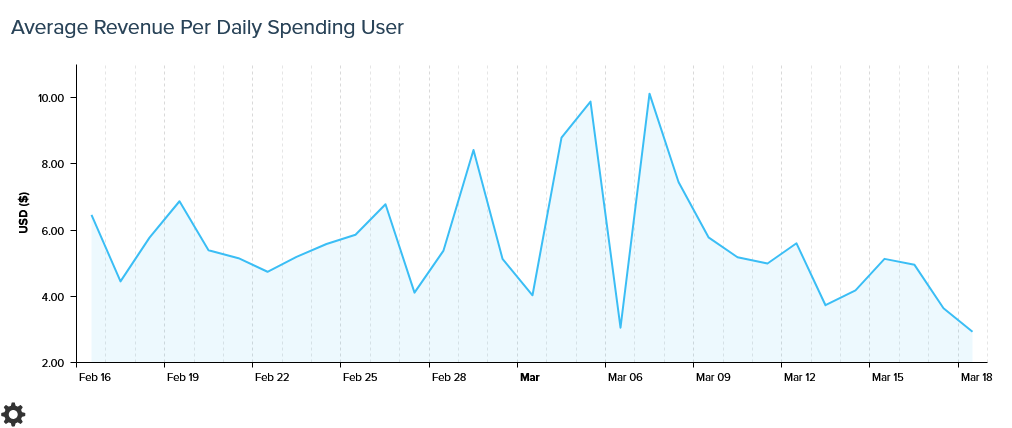
Average Revenue Per Daily Spending User is the total revenue divided by the number of unique paying users on a day. This gives a good measure of the amount players are spending in the game on a daily basis. The ARPPU is generally seen as a much better measure of the performance of a game compared to the ARPU. It shows you how much payers are spending and therefore the value of your spending payer base.
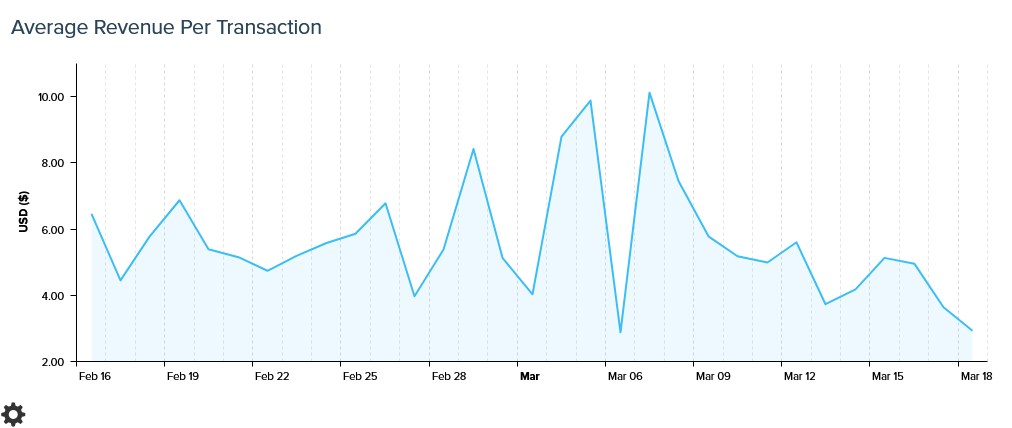
Average Revenue per Transaction is the total revenue divided by the number of transactions on a daily basis. As the playing base changes and the inventory expand it is possible to increase this metric. By deploying starter packs and bundles of goods it is possible to increase the average transaction value by giving players offers based on the purchase of combinations of goods that fit playing styles and strategies.
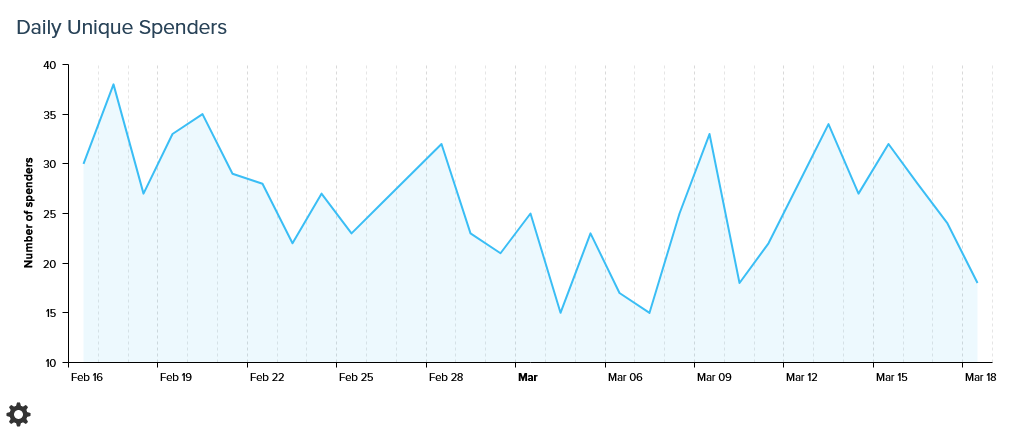
Daily Unique Spenders is the number of paying players on a daily basis. This gives you a good indication of the size of your paying base and the number of spenders in the game over a time period.
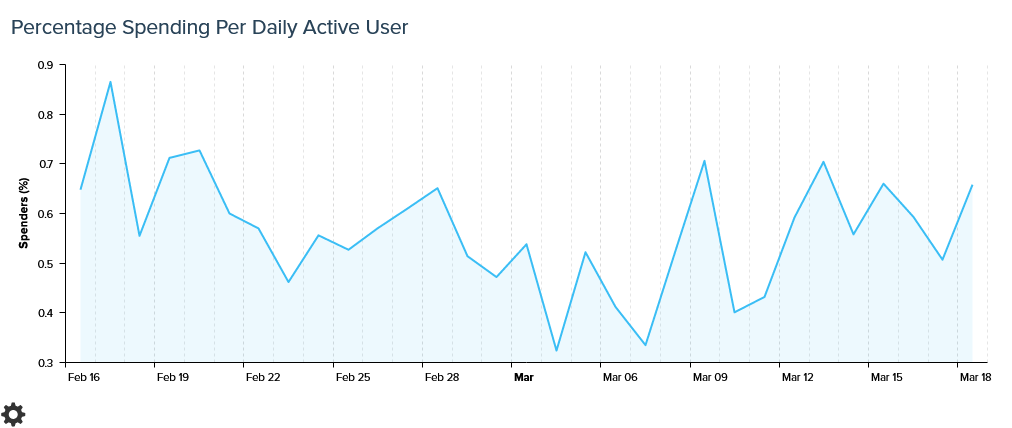
Percentage Spending Per Daily Active User is percentage of the daily player base that is generating revenue through purchases. This chart gives a daily snapshot of the % paying on that day. There are also a general number of percentages paying at the top of the page. This shows the % paying from the start of the data being collected up to the currently selected end date.
The % paying should ideally be above 2%, with very successful games above 5%. The % paying is very much based on the user base the game is focused on. Hard core games generally have a lower active user base and a higher % paying with more casual games the opposite.
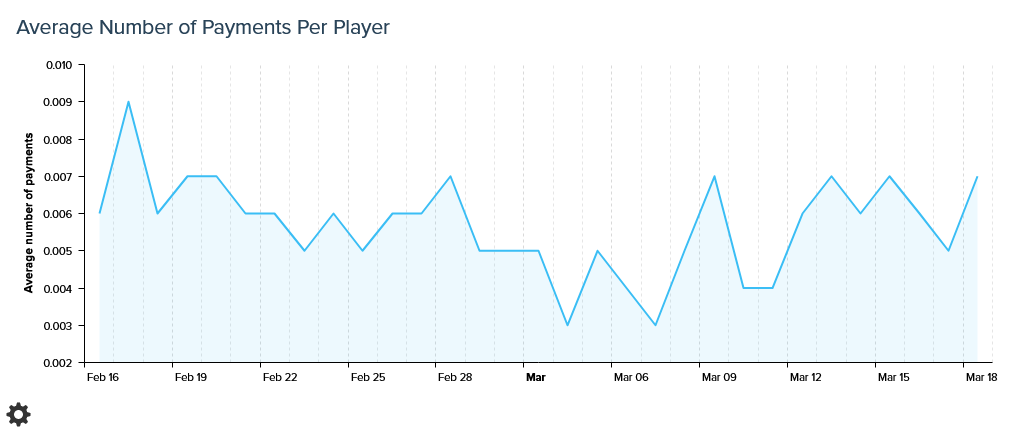
Average Number of Payments Per Player is calculated by taking the number of payments for each user and dividing it by the number of active users for that day. A drop in this chart may indicate that existing players are making fewer payments and/or that new players are less inclined to pay. Similarly an increase indicates an increased willingness to pay and/or a shrinking base of non-paying players.
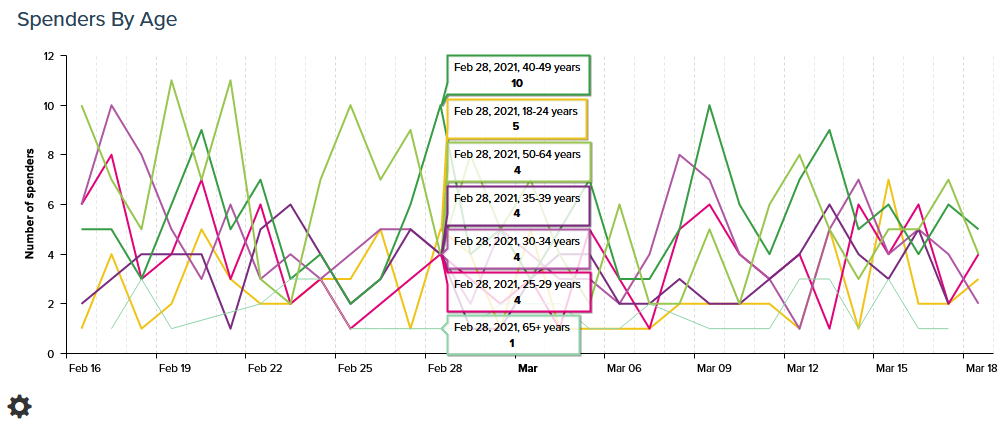
Spenders By Age is the banded ages of the spending daily active users. The age profile allows us to assess if the game is engaging to its core demographic. It also allows us to assess how well the game will monetize based on the split between adult and child age bands.
This chart can become difficult to read, so switching on and off player groups will allow a better understanding of which age groups are spending money.
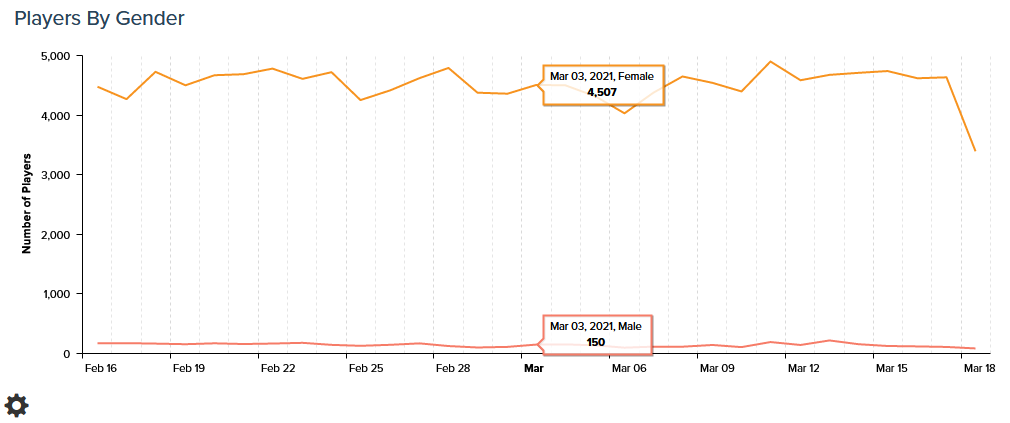
Spenders By Gender shows the number of spending daily active users per daily active user. The gender profile allows us to assess if the game is engaging to its core demographic. It also allows us to assess how well the game will monetize based on the split between genders.
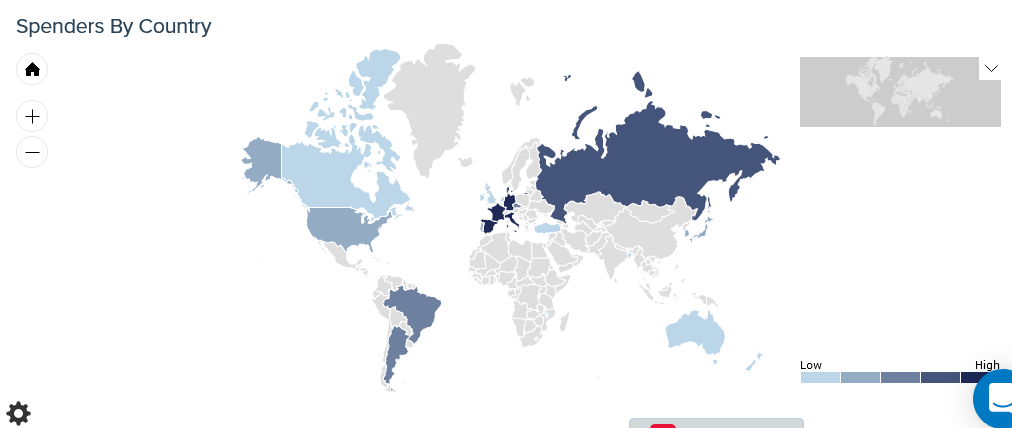
Spenders By Country is the number of spenders in each country during the selected date range in the dashboard filters.
Time to First Payment
When players start to spend money is a key indicator, often of players start spending too early they will not become committed spenders. This is because the initial payment is so important, possibly the most important event in a game. If players understand why they are spending, what they will achieve and get a better than expected result they are much more likely to repeat spend and move on to become a high spender.
Knowing when in the game players are making that first payment is therefore absolutely crucial and these charts begin to uncover this valuable behaviour.

Players By Time To First Payment shows the unique players by time to first payment banded in hours. The majority of players in the example are spending in the first hour of gameplay. This indicates that the game is monetizing early but none of the players are becoming a committed spenders.
Revenue by Time to First Payment is the total revenue split by the time played by the player before they make their first payment.

Revenue by Time to First Payment is the total revenue split by the time played by the player before they make their first payment for the date range defined in the dashboard filters.
Monetization Matrix
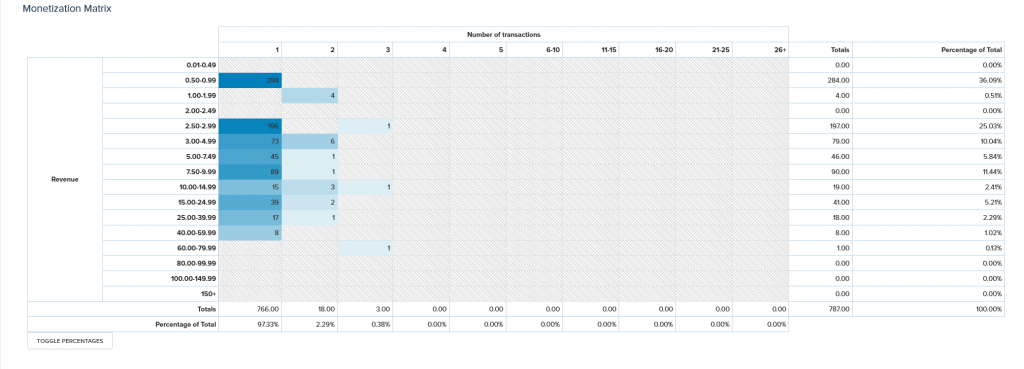
The Monetization Matrix shows track how much and how often users are spending. The matrix will only include players who have spent at least once. It shows the number of players who have spent money across a particular revenue band and how many transactions they have performed.
