At the top of each dashboard is the filter tool. This is used to control the data that is being displayed in the charts. The filters are used to control the data that is displayed in all the charts on the dashboard. Each of these filters can be used in combination, allowing a detailed analysis of player groups.
The displayed annotations allow meta data about the game to be displayed on top of the charts (see annotations tool).

Date Range
The date range selector allows the user to select either a range of dates or a single date and has a number of pre-defined ranges to make selection as easy as possible. This controls the dates of the data being shown in the charts and also affect summary and top ten charts.
Start Date Range
The start date is an extremely powerful filter. This filter allows the user to select either a single day or a range of days and look at players with a start date in this range. This makes it possible to look at only new players that have started on a specific day and see how they behave over a period.
Making a change to the game and looking at new players that experienced this new version, it is possible to see differences in behaviour, spending patterns and retention rates compared to a set of new players that only experienced the previous version.
This ability to cohort the players based on the date that they started and then look at those players across the full dashboard provides a huge level of power to understand how players are behaving in the game.
Using Acquisition Channels
If users are tagged with an acquisition channel these channels are made available through this filter. This allows all the charts in the dashboard to be filtered by acquisition channel. You can look at either a single acquisition channel or combing multiple acquisition channels.
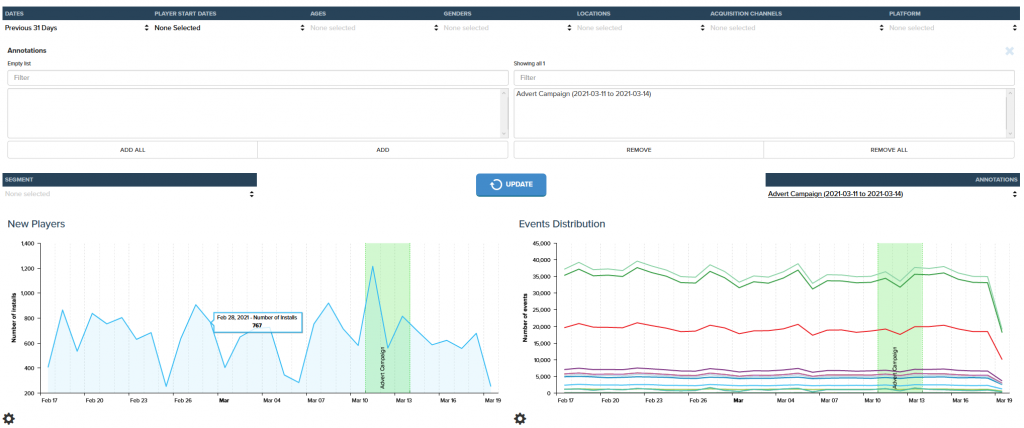
Displaying Annotations
Any annotations that are within the date range selected are available to be displayed. Selecting the annotations displays them on all the charts. The annotations are displayed in different colours depending on the type of annotation selected.
Segments
A segment that has been defined by the segment tool can be selected and used as a filter on the charts. When a game is created there eight auto generated segments that cover spending and engagement and these are available to all users.
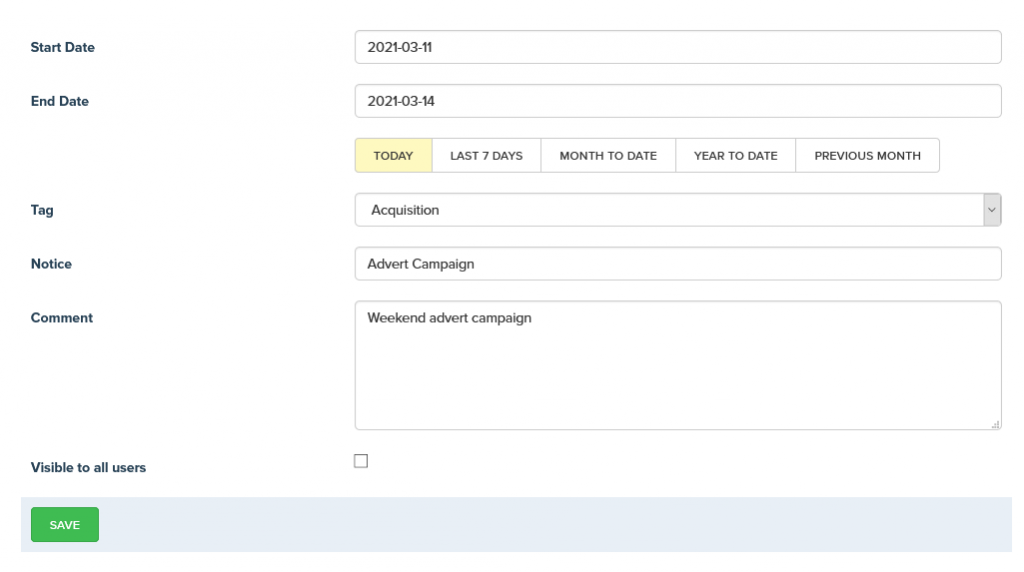
Annotations Tool
This tool allows extra information to be stored against a game; this can include version releases, acquisition channels, failures, changes to the event list, offers or promotions.
Each annotation can have a single date or date range and the related notice. The notice can be edited or even deleted.
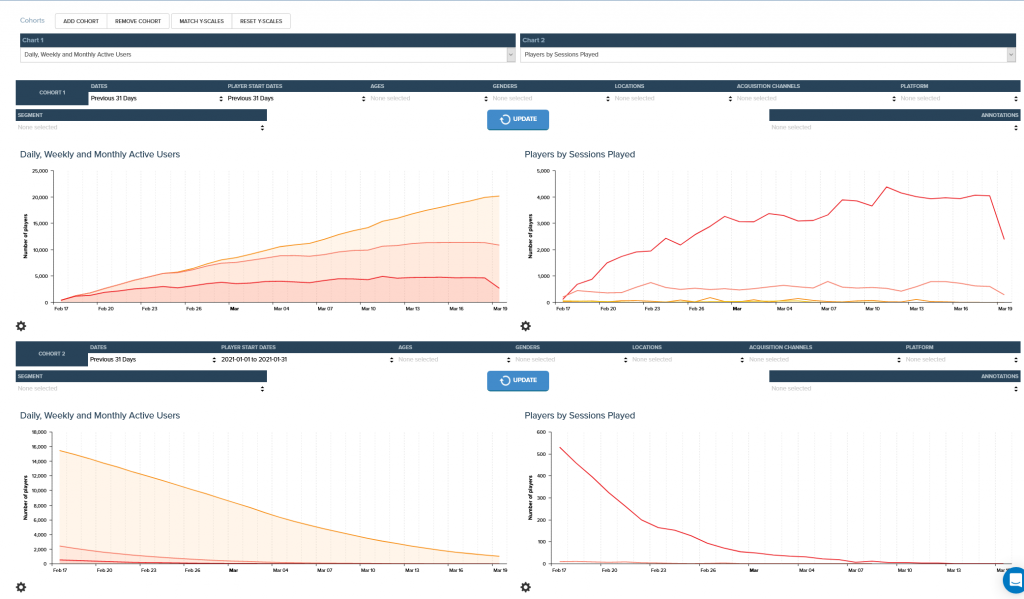
Cohort Comparison
A cohort of users is a subset of users, using the filter tool it is possible to look at users by gender, location, start date etc. Being able to compare cohorts of users is extremely useful, looking at new users before and after a major change in the game gives a good understanding of how the changes have impacted the user base. The cohort comparison tool provides a simple and intuitive interface to do this.
The control panel at the top of the interface allows you to define the two charts that are being displayed for each cohort. All the charts that are available in the main dashboard are available in this tool.
By default the tool creates two cohorts, it is possible to add a further 8 cohorts to the interface if required. For each cohort the standard filter interface is available so a different cohort can be defined and compared across cohorts.
It is also possible to allow the y-axis of the charts to be aligned for each chart to provide a best fit for the y-axis.