Four QA tools can be accessed from the SETUP section of the navigation menu on your DEV and LIVE environments to test your Engage implementation.
Engage Browser
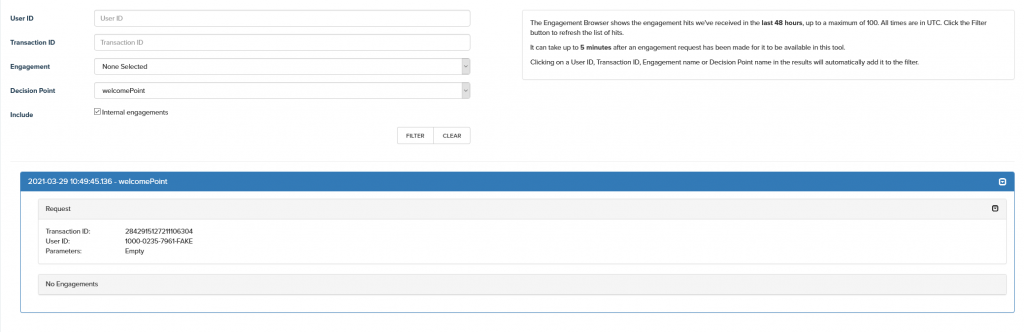
The Engagement Browser shows engagement hits received in the last 2 hours up to a maximum of 100. The results displayed by this tool can be filtered by userID, transactionID, engagement campaign or decision point. You can inspect engage requests and see the parameters sent with them and see if an engagement was triggered. If an engagement was triggered you will be able to see which campaign it was and any response parameters.
Note:
- All times are in UTC.
- It can take up to 5 minutes after an engagement request has been made for it to be available in this tool.
- Click the Filter button to refresh the list of hits.
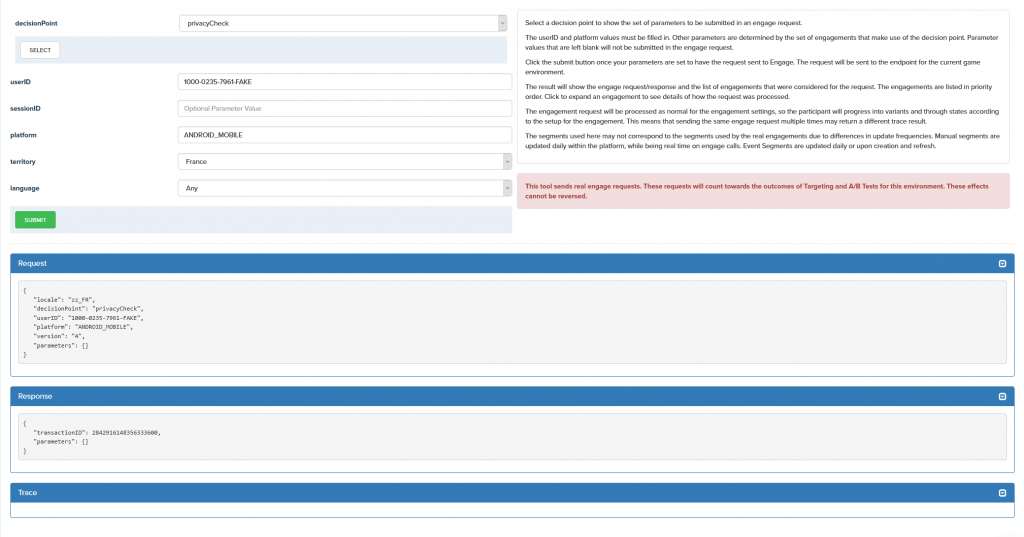
Engage Trace Tool
The Engage Trace Tool provides a mechanism for creating an engage request from within the deltaDNA platform, submitting it to Engage and inspecting the response along with more detailed output that will help you understand the logic that led to the specific response.
The response not only shows the Engage output, but detailed traces showing each campaign considered in the decision making process.
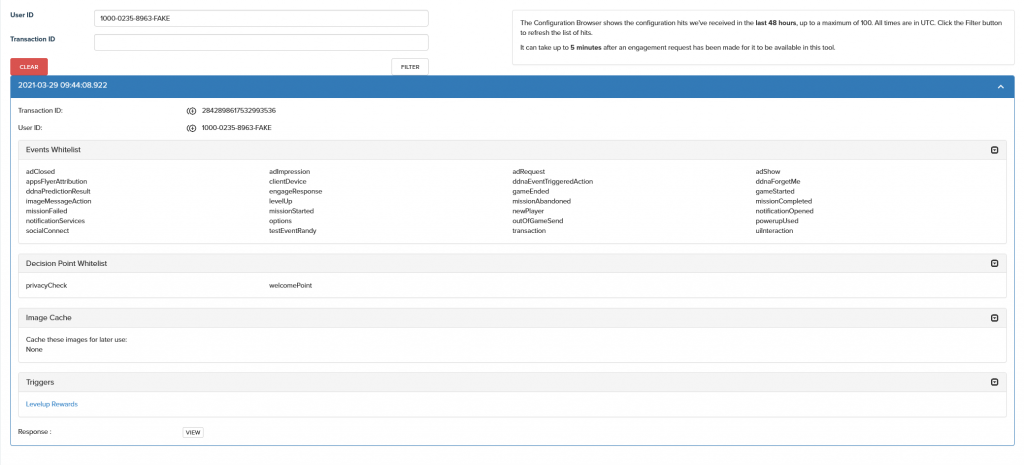
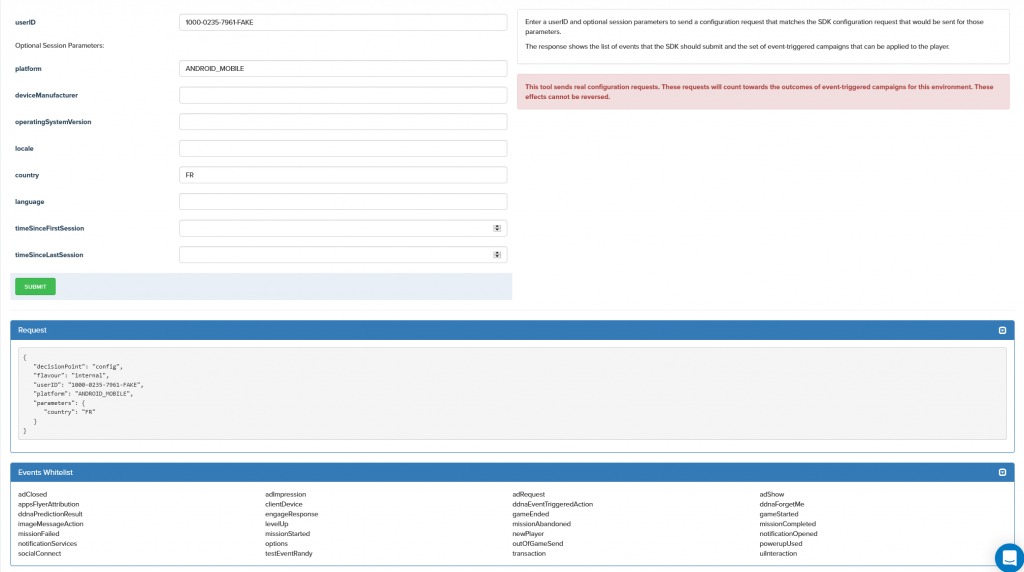
Config Browser and Config Trace Tool
The Config Browser and Config Trace Tool work in the same fashion as their engage equivalents. However, these tool look at any cofiguration requests that the platform receives. These tools show what events the user has been whitelisted for and which decision points they have been whitelisted for, the triggers that the user has been registered for, any images cached for image message actions and the full JSON response sent to the user.