Measure dashboards contain approximately 50 standard charts that are common to all games. They are populated from a set of common event which are added to each game when it is created. Check out our pre-configured events and events that drive the dashboard for more information.
Measure charts can be filtered by event date ranges, player start date cohorts, platform player acquisition channel and your own custom player segments.
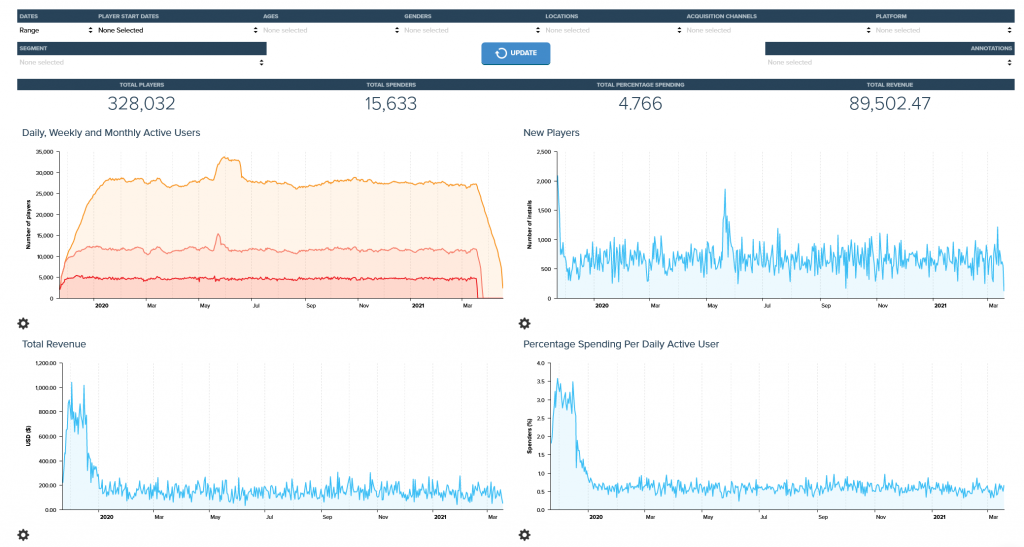
The charts are grouped into 5 sections:
- Summary: A high level summary page
- Retention: A collection of pages with charts on retention, engagement, sessions and retention matrices
- Monetization: Revenue, first payment charts and a monetization matrix
- Game Dynamics: Charts covering player behaviour including the missions they are playing, items they are purchasing, social behaviour and demographics
- Tools: Various tools for annotating your measure charts, setting up alerts, creating custom charts and running cohort comparisons
Measure charts display data with a daily granularity and typically updates every hour.