
The LTV optimizer tool allows you to determine how much revenue your players will generate over a 90 day period, and to filter and segment those players to identify which characteristics are associated with high value players.
To use the LTV optimizer, begin by filtering your player base to isolate the player start dates, demographic filters and segments you wish to analyze.
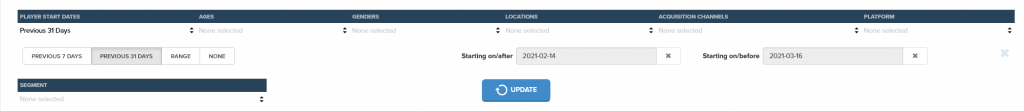
It is important to carefully consider your choice of player start dates. The LTV optimizer estimates the revenue generated in a 90 day window from the player start date i.e. the day a player installs is Day 0 and the estimate will be calculated from this day to 90 days in the future.
If all the player start dates are more than 90 days ago then the LTV optimizer will work exclusively with actual revenue data. If some, or all, of the player start dates are less than 90 days ago a prediction will be made to fill the gap between today and Day 90. In the case where only a fraction of the player start dates are less than 90 days ago, the prediction will be based on the weighted combination of actual revenue data, and predicted values, with the weighting equal to the actual number of installs that occurred on each date.
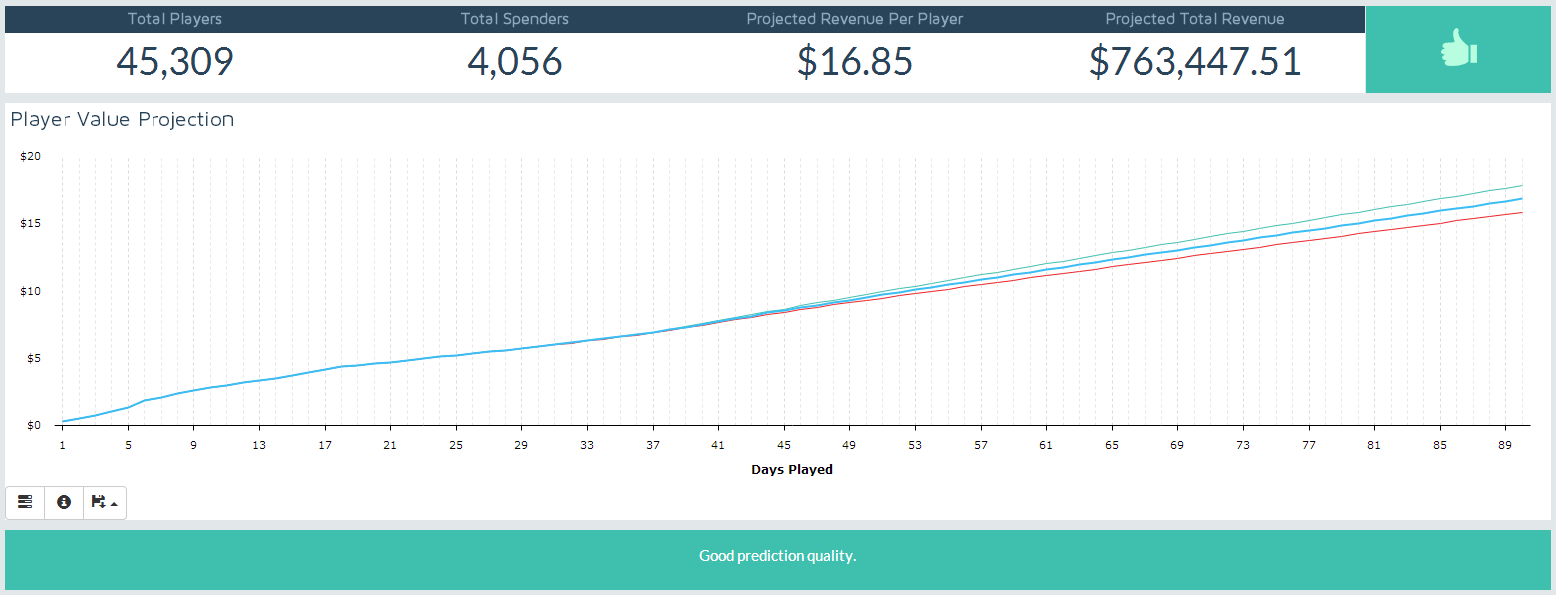
Once you have chosen the player start dates, filters and segments you wish to analyze hit the UPDATE button to run the LTV optimizer tool. This tool summarizes the results in a value bar and a chart.
The four values returned by the LTV optimizer are:
- Total Players: this is the total number of players that installed between the selected start dates, and satisfy the filter and segment selections
- Total Spenders: this is the total number of spenders within the selected player cohort
- Projected Revenue Per Player: This is the total amount each player will spend on average within 90 days of install
- Projected Total Revenue: This is the total amount of revenue this player cohort will generate within 90 days of install
The Player Value Projection chart shows the cumulative projected revenue per player that is generated in the period from install to the Days Played. The blue line shows the best estimate of the revenue per player, while the green and red lines show the maximum and minimum value, respectively, within which that the revenue per player could fall.
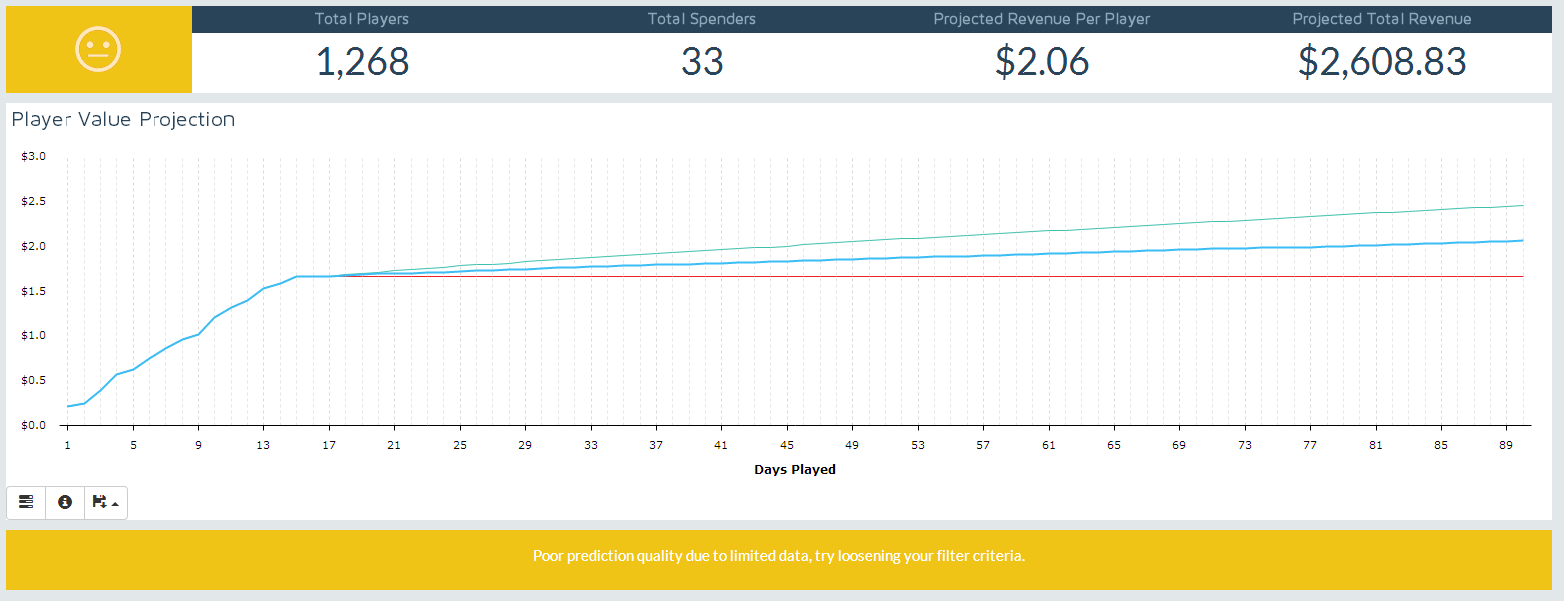
As the LTV optimizer works by projecting from actual data observed for a selected cohort, it will fail to give an accurate prediction if the number of player and spenders falls too low. If the total number of spenders in the selected cohort is less than 50 the prediction will be based on default model parameters. In these cases the tool will produce a warning and the chart will look like this:
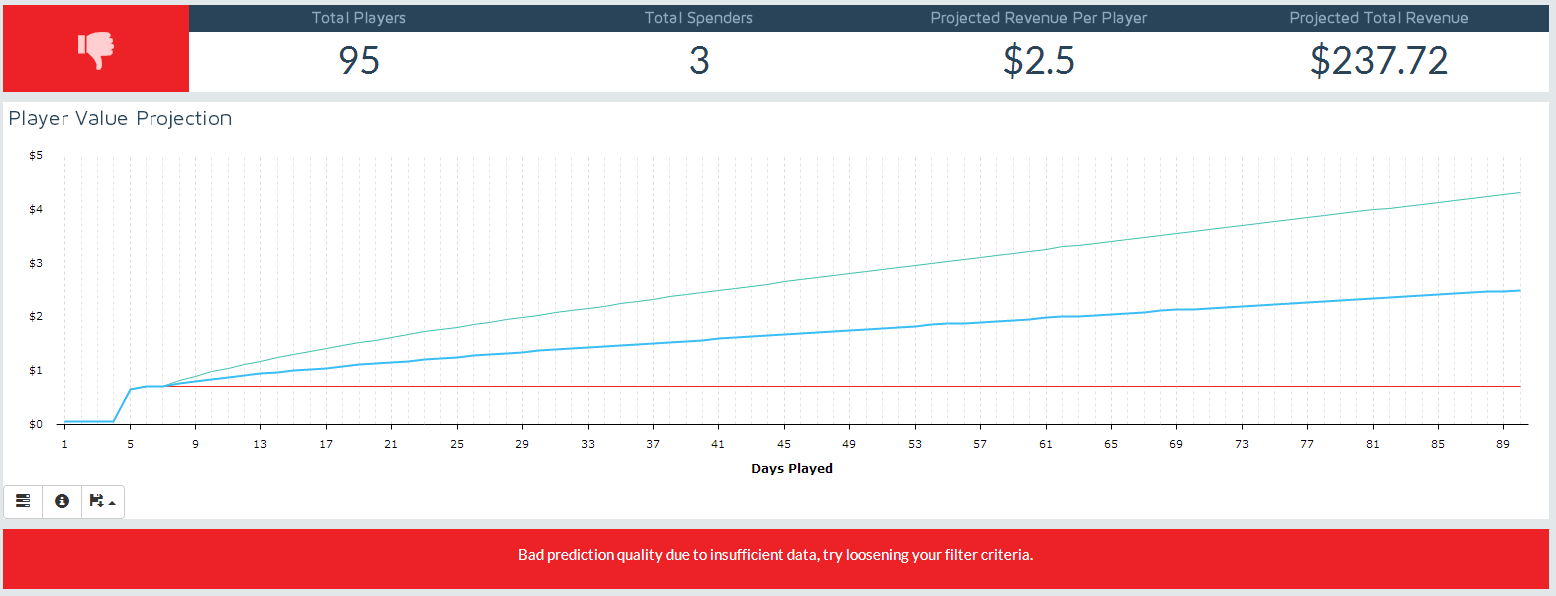
Revenue estimates produced in these cases should be treated with caution. If the total number of spenders falls below 5 the LTV optimizer cannot return meaningful results. In these cases the returned predictions should not be used. If the total spenders is less than 5 the LTV optimizer chart will look like this:
LTV = <S>CT
Where <S> is the mean transaction amount, C the conversion rate and N the number of transactions per spender. For a cohort of players we will know <S>, C, T to a certain observed day d, so to predict LTV we need to work out what these value will be at some day d+X. How our calculator works is to fit the transaction data directly with a range of parametric probability distributions (e.g. pareto, gamma, exponential etc) via MLE methods and then use the fit to work out what how many more Conversions and Transactions there will be based on what we have seen. The mean spend is the odd one out here, there we simply take the mean value of transactions which are greater than the avg. number seen so far.
The fits from the multiple probability models are averaged based on how well they fit the data to produce the final estimate. Confidence intervals are generated by the variance between the models, and by bootstrapping the data.

