
Custom Dashboards let you group related charts together in to themed reports and share them with your colleagues.
- Overview
- Using custom dashboards
- Configuring custom dashboards
- Creating custom charts and Queries
- Organising custom dashboards
Overview
Custom Dashboards display a collection of charts and are an excellent way to group related charts together in to themed dashboards. They can be marked as private or shared with your colleagues. They can be viewed within the deltaDNA platform or automated for delivery by email, to selected users, at a frequency of your choosing. Custom dashboards can be tagged and organised into groups that can then be exposed on the navigation menu.
Custom dashboards can display up to 48 charts or tables from the following sources:
- Data Mining queries written in SQL
- Slice & Dice queries
- Funnels
- Legacy Measure charts designed by deltaDNA
- Text panels that are frequently used to contain a description of the dashboard contents.
Using Custom Dashboards
To access custom dashboards, navigate to DASHBOARD > CUSTOM DASHBOARD > All. They can be organised in to groups to keep the navigation list from getting too long.
Custom dashboards are cached to ensure optimal performance, despite potentially containing a large number of individual displays. There is a note at the top of the page that indicates when the cache was last refreshed and a refresh button to refresh the cache.
The Use Filter toggle switch is used to show or hide the standard dimensions filter bar at the top of each dashboard. You will need to click the refresh button after applying a dashboard filter in order to reload the charts with the new filter applied. Please Note: the standard dimension filters may not be applicable to some chart types.
The Set Favourite toggle controls whether the individual dashboard is included in your personal favourites list in the navigation menu. This can also be set on the All dashboard management page.
The Edit Dashboard button takes you to the custom dashboard editor, where you can modify your dashboard.
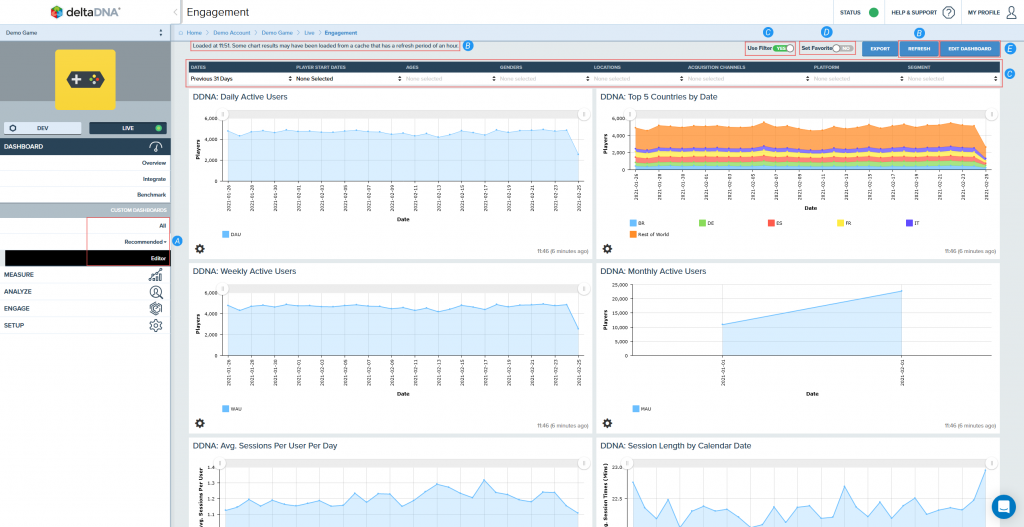
A: Custom dashboard access B: Refresh C: Filters D: Set favorite E: Edit dashboard
Configuring custom dashboards
To acess the custom dashboard navigate to DASHBOARD > CUSTOM DAHSBOARDS > Editor in the side bar, or by clicking the Edit Dashboard button on an existing dashboard.
The editor is divided into four regions.
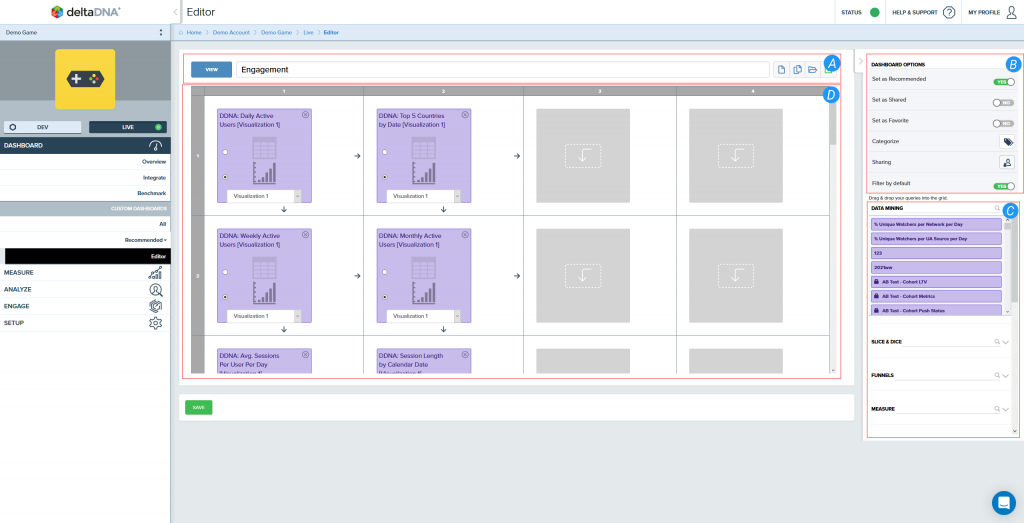
A: Toolbar B: Dashboard Options C: Chart Selector D: Display Editor
The Toolbar contains tools to:
- Toggle between View and Edit modes
- Note, a dashboard needs to be saved before you can view it
- Name your dashboard
- This can be changed later
- This can be changed later
- Create a New empty dashboard
- Copy the existing dashboard to a new one
- Load an existing dashboard
- Save the current dashboard
The Dashboard Options section lets you:
- Specify if the dashboard can is Shared or private to you
- Set the dashboard to Favourite to make it show up in the favourites section in the navigation menu
- Add category Tags to the dashboard, so that related dashboards can be grouped together and even displayed on the navigation menu
- Specify which Users can access the dashboard when it is shared
- Delete the dashboard
- Set whether the Filter bar is visible or hidden on the dashboard, by default
The Chart Selector region contains 6 panels holding all your saved chart queries. The panels can be minimised or maximised to reduce screen clutter and you can filter their contents by typing in to the header. The panels contain lists of saved Data Mining Queries, Slice and Dice Queries, Funnels, Measure Charts , Text Panels and Legacy Measure Charts. Use these panels to find the charts you want to put on your custom dashboard, then drag and drop them in to position.
NB – The Insight team at deltaDNA can curate and publish new dashboards to all accounts, they will appear in the Recommended section of your navigation menu. We will be gradually improving and replacing many of the older Measure charts, but the Legacy Measure section will still contain the older charts for your convenience.
The Display Editor lets you change the position and size of up to 48 custom tables or charts per dashboard page.
- Drag & Drop a saved queries from the Chart Selector panels in to one of the 48 cells in the display editor to add to the dashboard.
- Drag and Drop from one cell to another to move a chart
- Use the arrows inside the chart cell to change the size or shape of a chart, e.g. the number of display cells that it spans.

- Remove a chart or table from the custom display by clicking the delete icon
 or dragging the table/chart out of the display area.
 - You can specify whether a query from Slice & Dice or Data Mining is displayed as a table or a chart by selecting the radio button next to the appropriate icon in the custom dashboard display panel.
Click on the Save button on the Toolbar at the top of the Custom Dashboard Editor.
Creating Custom Charts and Queries
Charts created in the Data Mining, Slice & Dice or Funnel tool all use the same common toolbar to save them for later use in a custom dashboard
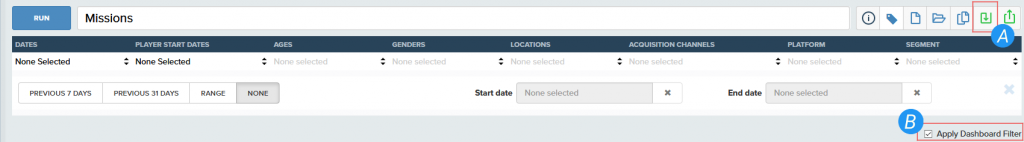
A: Save B: Dashboard Filter
- Once you have created a query and defined the visualisation options you can save the query in order to make it appear in the relevant custom dashboard chart selection panel.
- The Dashboard Filter can be used to preview what your chart will look like when various filter options are applied to it.
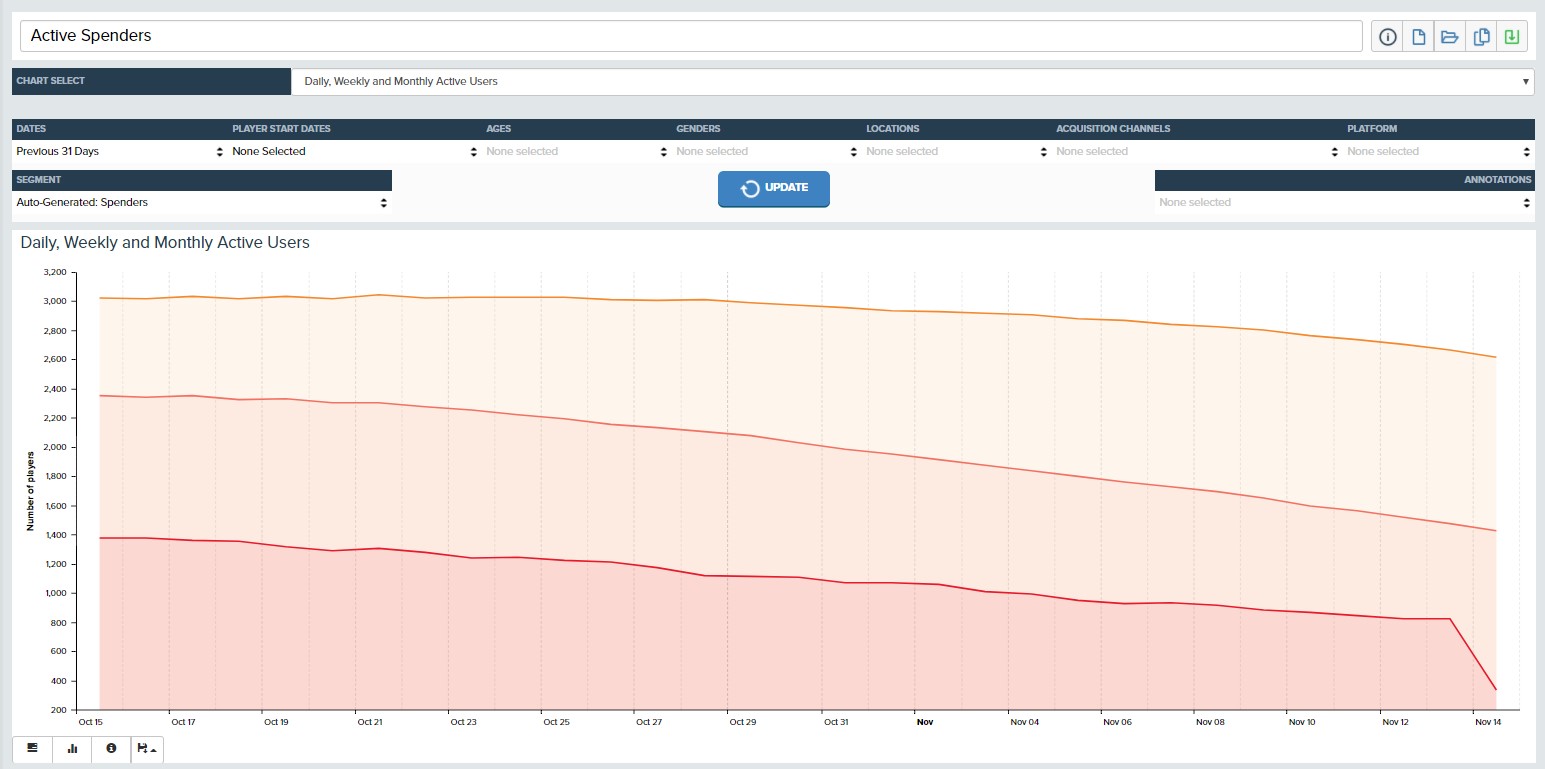
Measure charts are slightly different than charts created in the Analyze section. They are existing charts with a defined set of filters applied to them. The Custom Chart builder can be accessed from Measure > Tools > Custom Charts. You can use the Chart Select list to choose which chart you wish to work with, then setup your filters as you would with any other Measure chart and finally name it and save it.
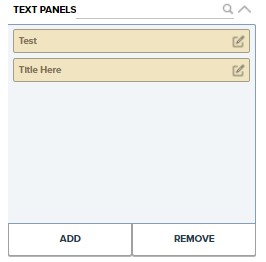
Text Panels are often used to provide a longer description of the custom dashboard or an individual chart on to the custom dashboard. They can be created and edited directly from the custom dashboard chart selection panel.
Organizing Custom Dashboards
Navigating to DASHBOARD > CUSTOM DASHBOARDS > All will take you to the custom dashboard management tool. From here you can manage and organize your dashboards and even alter the Custom Dashboards navigation menu structure.
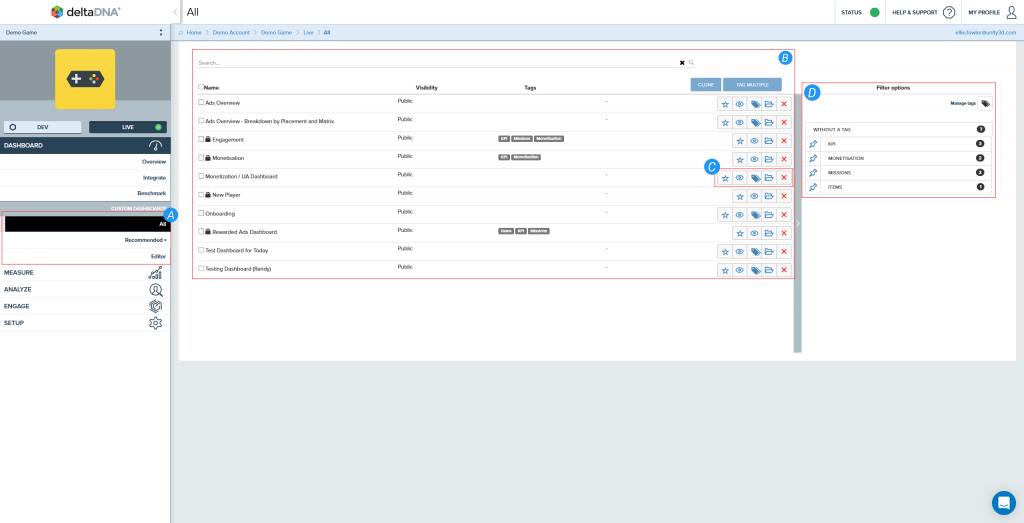
A: Navigation menu B: Custom dashboard list C: Dashboard management controls D: Tag manager
The custom dashboard navigation menu lets you access individual custom dashboards or the dashboard management tools. Dashboards are grouped together, some groups such as All, Favourites and Recommended are common to all games, but you can use the Tagging system described below to create your own dashboard navigation categories that will appear on the menu.
The Custom Dashboard List shows all your custom dashboards in alphabetical order.
- You can search or filter long dashboard lists by typing in the search panel at the top
- Each dashboard contains legends to showing their visibility and privacy settings, as well as any tags associated with them
- You can multi-select dashboards and apply tags to all of them simultaneously by selecting them with the checkbox to the right and clicking the Tag Multiple button.
Each dashboard has it’s own dashboard management controls. The four buttons to the right of each dashboard list item let you:
- Toggle the Favourite setting for the dashboard. This will determine if it shows up in the favourites section of the custom dashboard navigation menu
- View the custom dashboard. If you want to view the charts on a custom dashboard.
- Tag an individual dashboard. Clicking the tag button will open the tag manager for this dashboard. From here you can add or remove tags to this dashboard. Each dashboard can have multiple tags associated with it. The same tag can be associated with multiple dashboards. Tags are used to group dashboards together in to themed categories. These are the same tags that can be assigned to events and parameters elsewhere on the platform, to group them together.
- The Load button will open the individual dashboard in Edit mode so you can modify it.
The Tag Manager shows you which tags are associated to custom dashboards and lets you manage the tags.
- The Manage Tags button will open the tag management tool. From here you can add, edit or remove tags from the overall list of tags. You can also pin a tag which will cause it be displayed in the custom dashboard navigation.
- Below the manage tags button is a vertical list of all the Tags that are currently associated to your dashboard. At first, you will only have a “WITHOUT A TAG” section, but as you add tags to your dashboards the list of tags will grow. The number to the right of the tag name indicates how many dashboards have this tag assigned. The pin icon to the right indicates if the tag is displayed in the custom dashboard navigation menu.

