Mission Difficulty Analysis Example:
In this scenario the goal is to understand the player progression through the game missions to identify if any missions are be too difficult and could be leading to players defecting.
We will use the Slice and Dice tool and the “deltaCrunch” demo to delve in to the data uncover any potential issues with missions.
Firstly open the Slice & Dice tool from the Analyse menu.
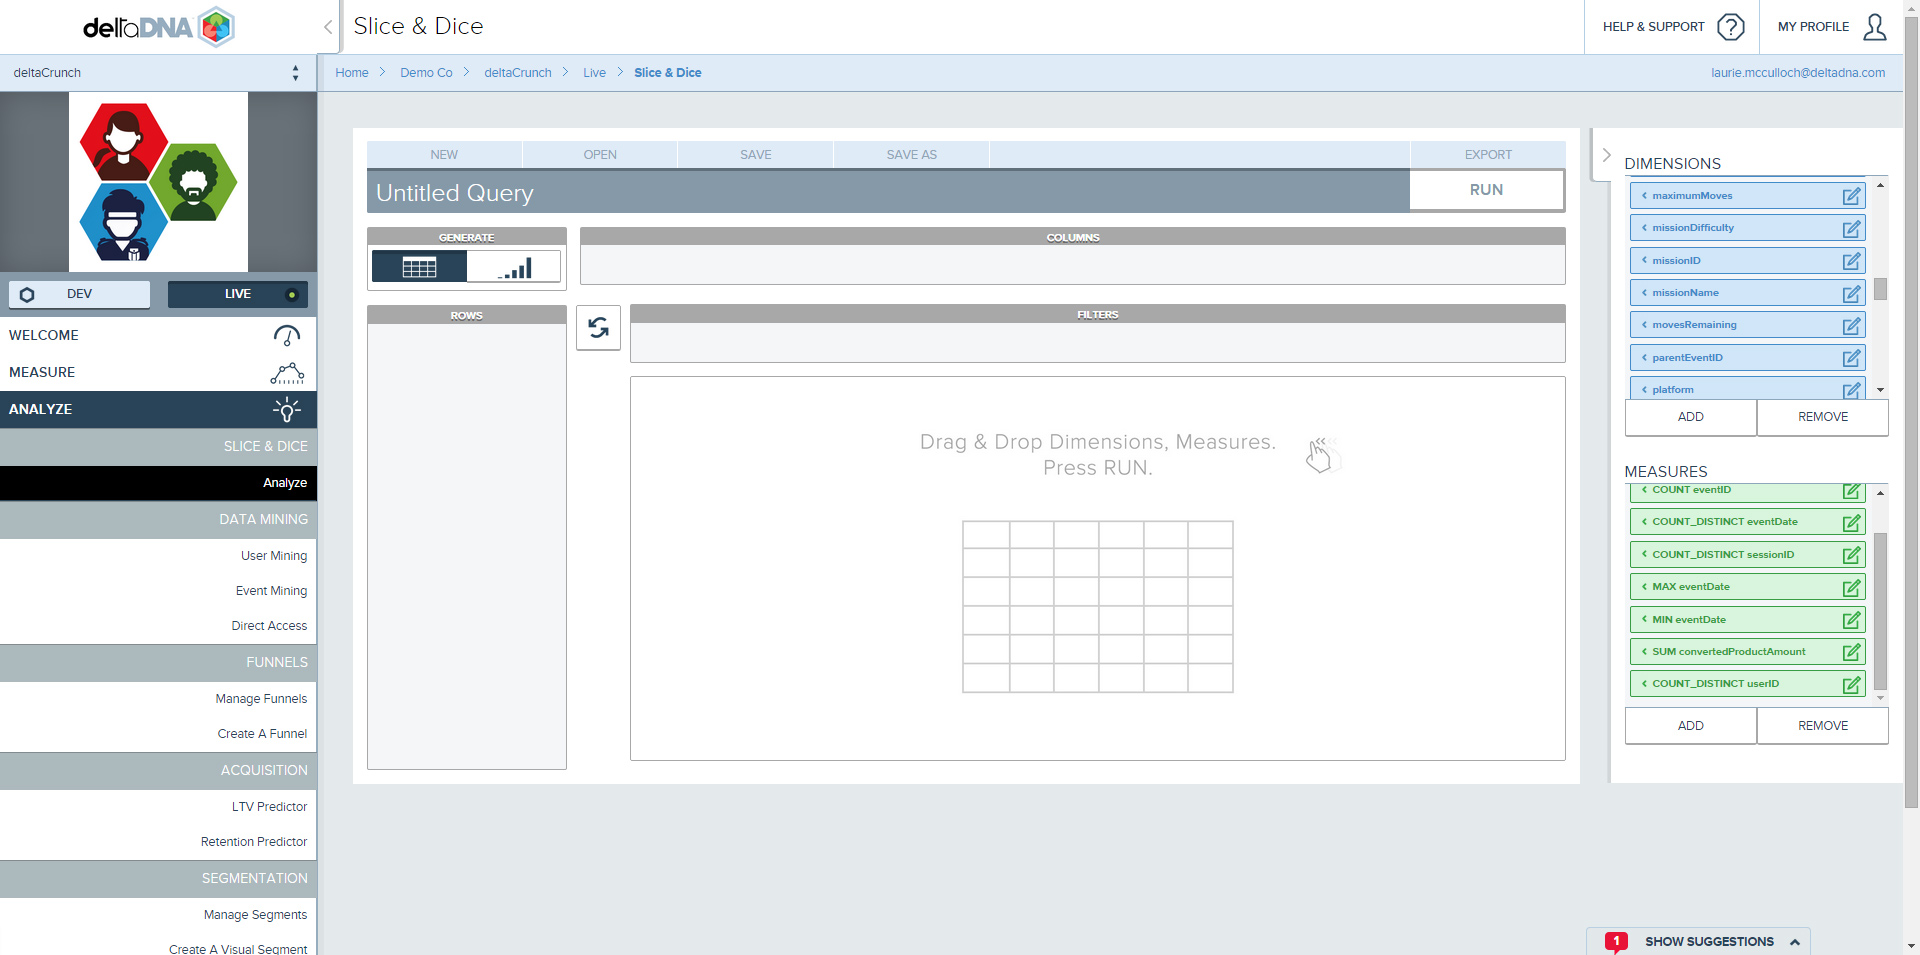
We next select mission Name dimension and drag it in to the Rows panel.
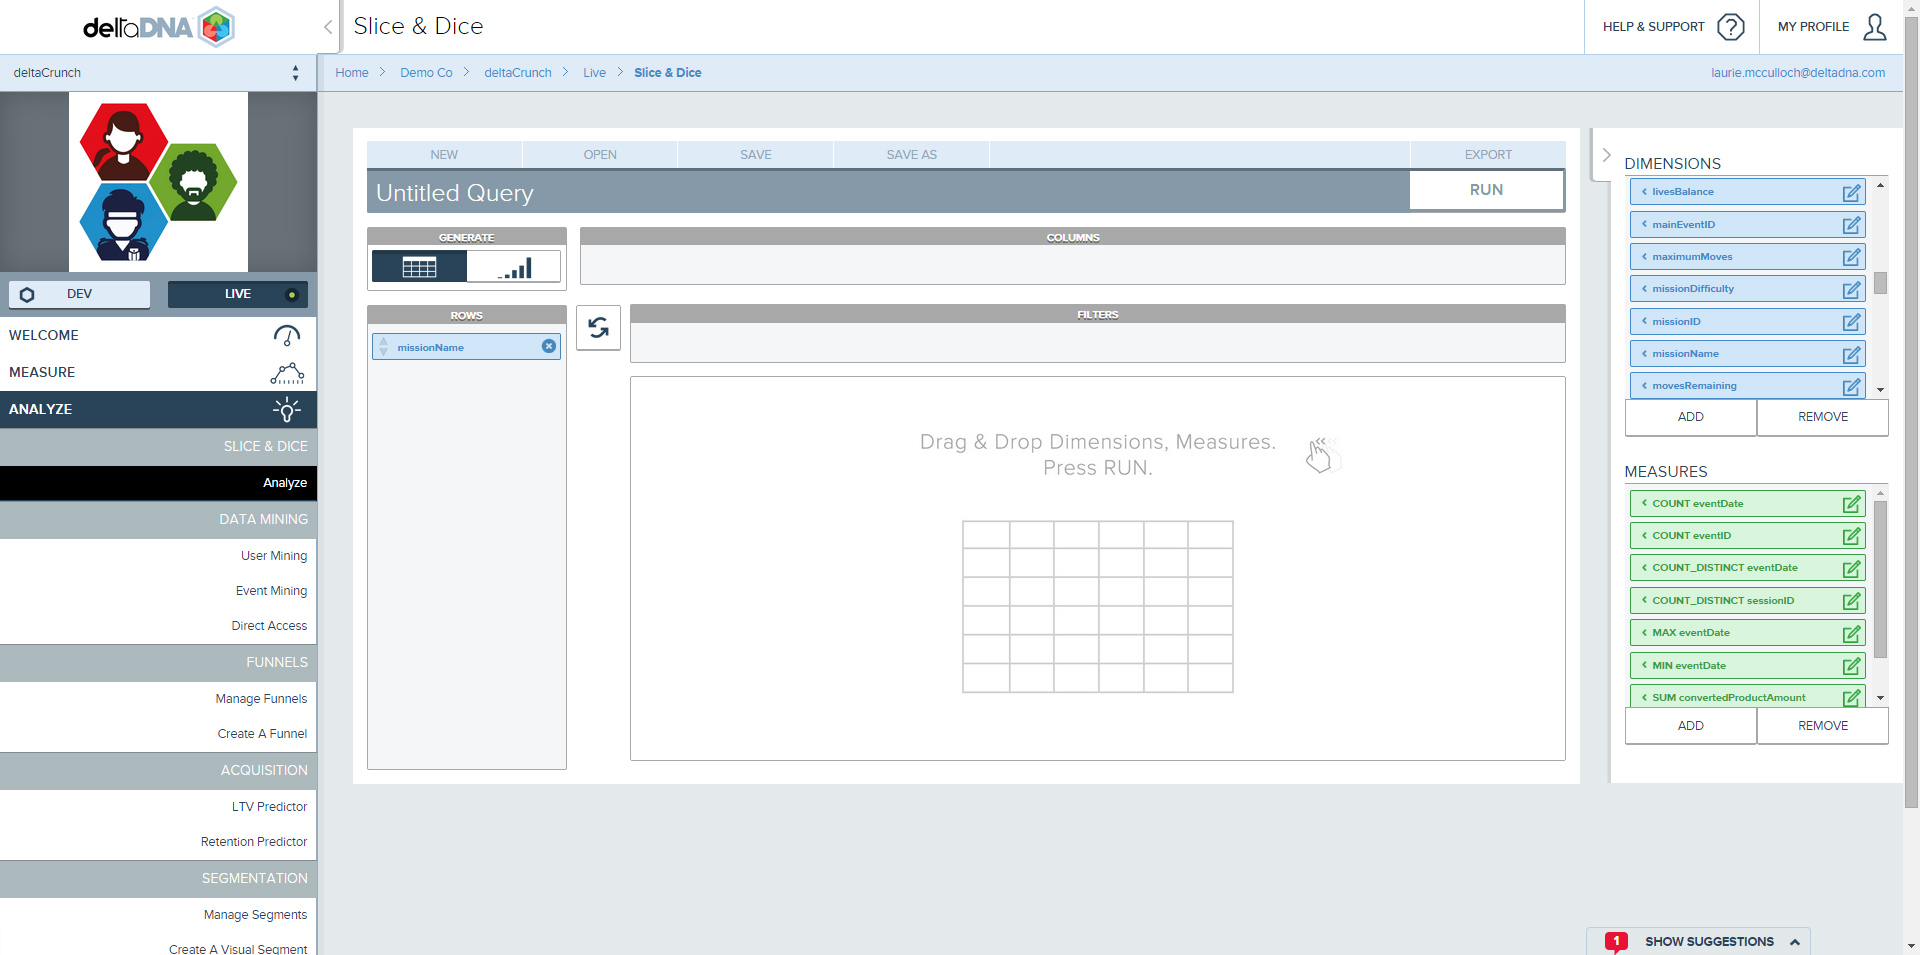
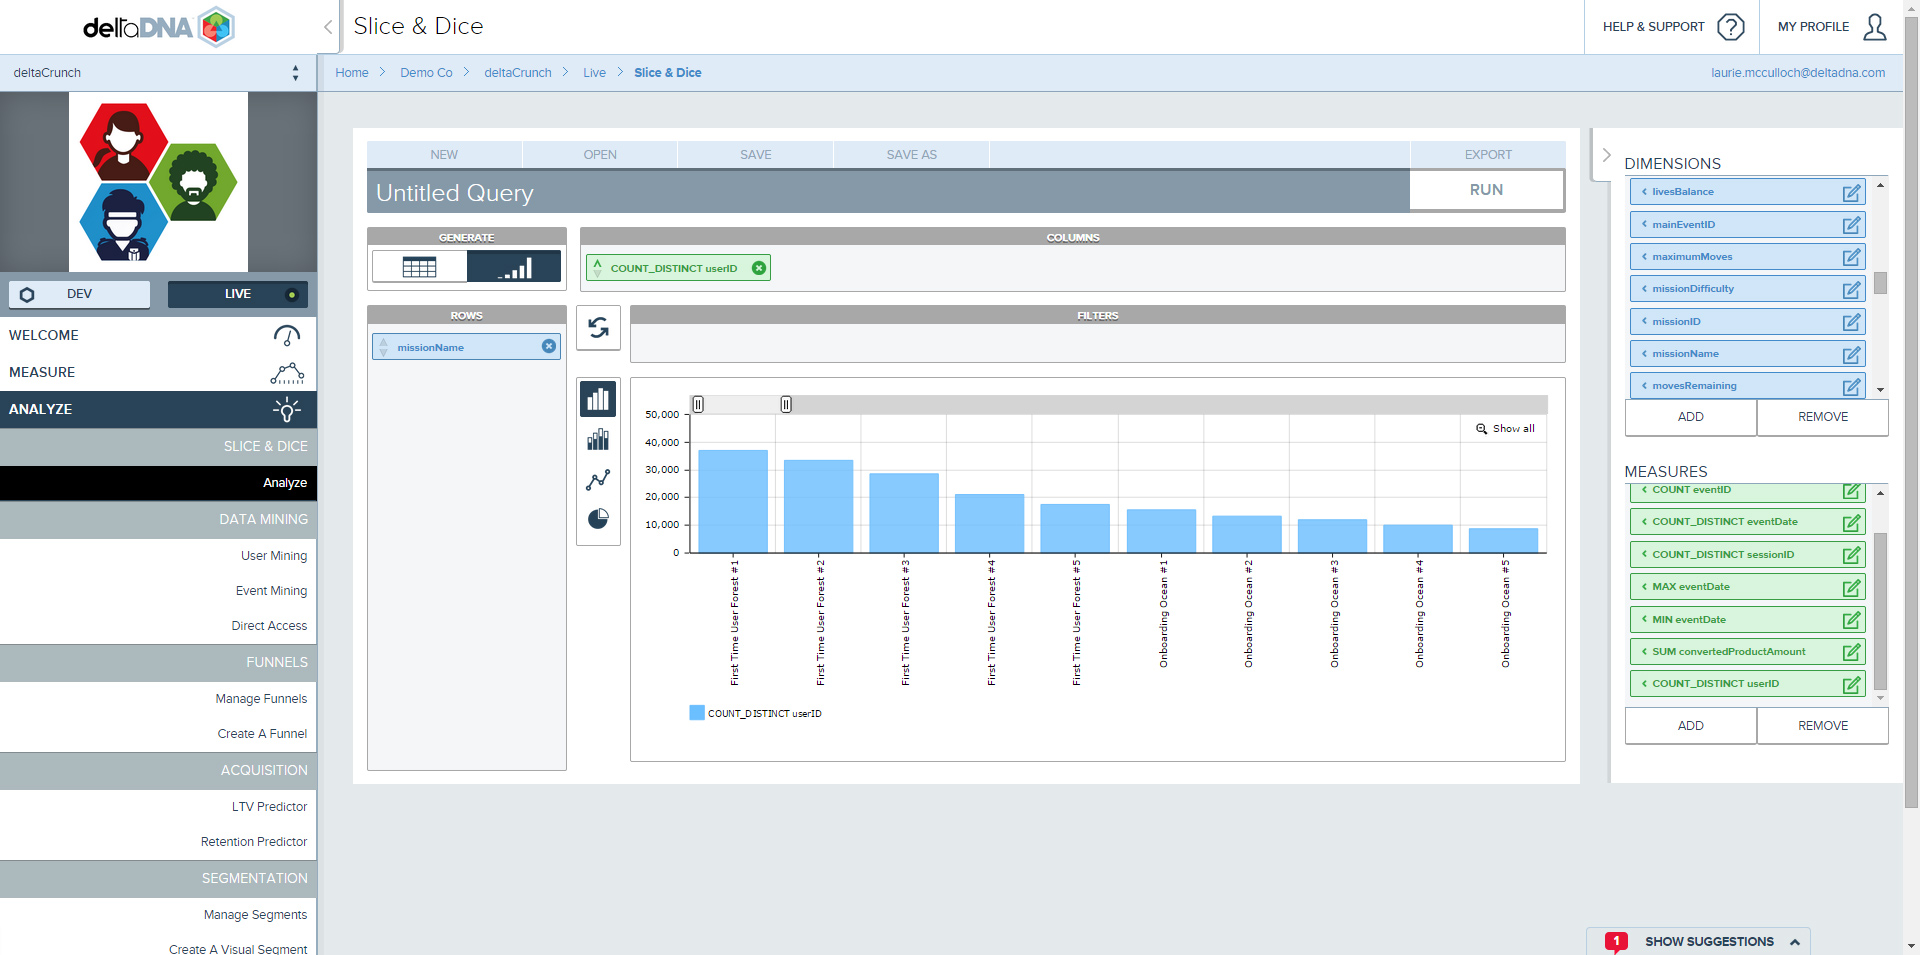
And then drag the COUNT_DISTINCT userID Measure ( aka Unique users) to the Columns panel and press the RUN button.

Lastly sort Unique users by descending volume to put the Missions in the correct order. This is done by clicking the down arrow ![]() icon on the COUNT_DISTINCT userID Measure.
icon on the COUNT_DISTINCT userID Measure.

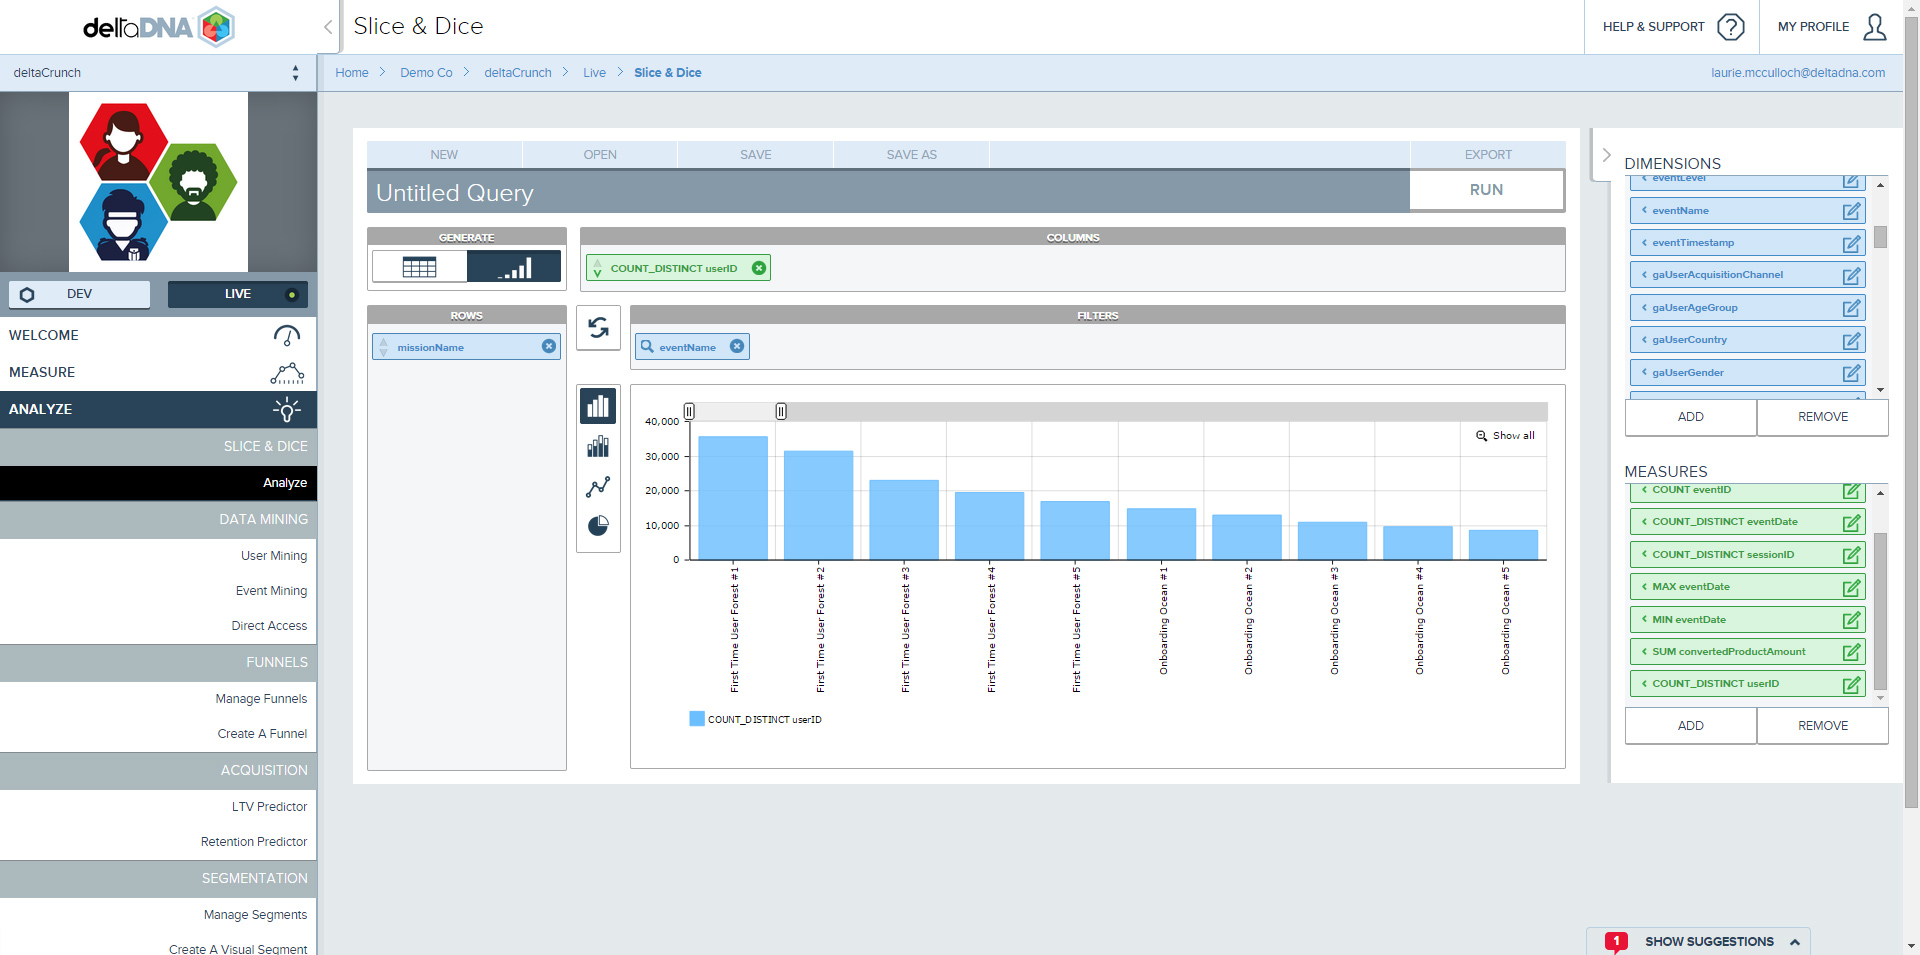
Clicking on the Chart ![]() button will display your mission data as a chart so you can see the mission started and completed results. You can use the slider bar to zoom in on specific areas of the chart .
button will display your mission data as a chart so you can see the mission started and completed results. You can use the slider bar to zoom in on specific areas of the chart .
The chart was showing us missionStarted and missionCompleted events. A more valid analysis would be to focus on just the missionCompleted events by filtering the chart based on the eventName. Drag the eventName dimension to the filter panel, click on the Filter ![]() icon. Select the missionStarted event name and Add it to the filter list.
icon. Select the missionStarted event name and Add it to the filter list.
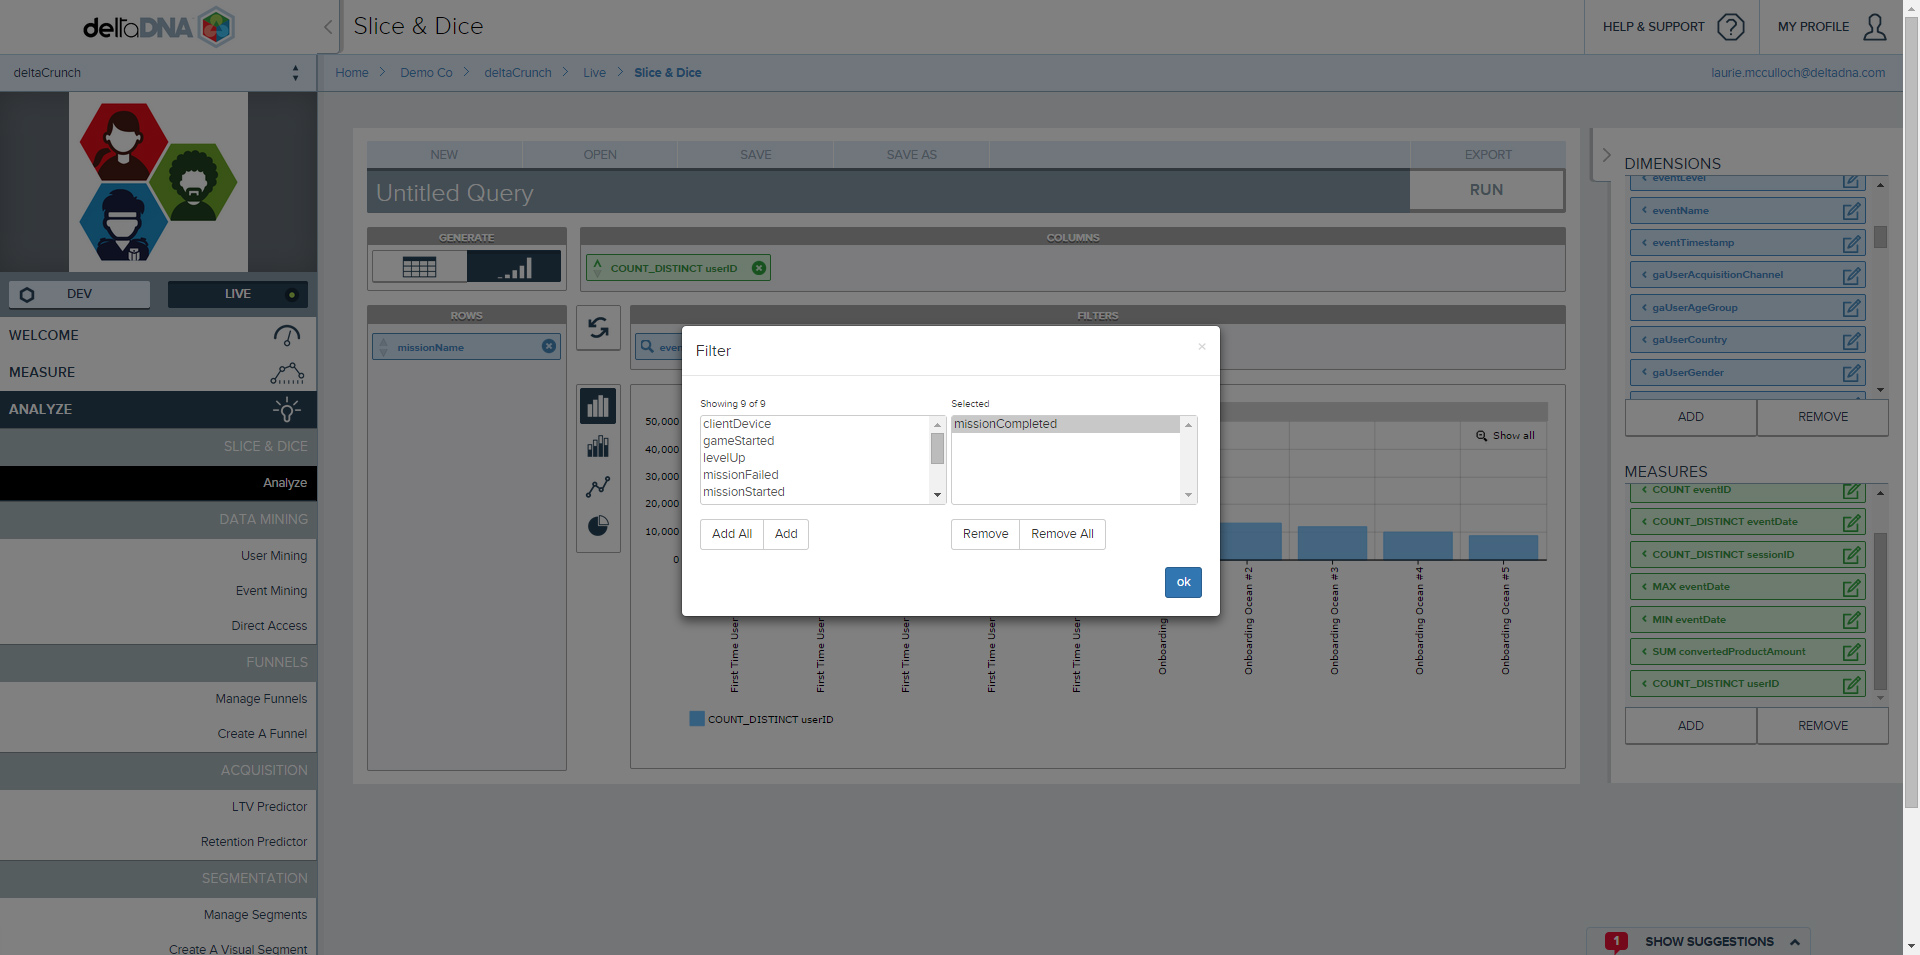
When you re-RUN your query you’ll notice that the completion rate for First TimeUser Forest #3 mission is showing a more of a drop off than expected. This could suggest that this mission is too difficult and may be causing players to leave your game.