
Acquisition Analysis Example:
This scenario is looking at the acquisition channels to understand how the different channels are impacting monetisation and retention.
The demo data has three acquisition channels set up, AC1, AC2 and AC3. By selecting an acquisition channel on the filter bar it is possible to look at just the users that came through this channel across all the charts. This makes is incredibly easy to look at the impact of acquisition on player behaviour as well as key metrics.
An acquisition was run from the start of January for 5 days across the three acquisition channels. The aim is to look at the impact of this acquisition spend to see differences between acquisition.
The filter was set up to look at data across January 2013, with a new player cohort of players that started between the 1st and 5th of January. The aim was to specifically look at Acquisition Channels AC1 compared to AC2.
- Select date range 2013-01-01 -> 2013-01-31
- Select user start date2013-01-01 -> 2013-01-05
This is looking at a player base of 23,386, with 2,807 paying players over the month.
Acquisition Channel 1(AC1)
Selecting AC1 in the Select acquisition channel
- Select monetisation/revenue
Looking at total revenue generated by this cohort, the revenue fluctuates between $600 and $5,000, the total revenue over the period is $49,450 with an Average Revenue per User of $0.8
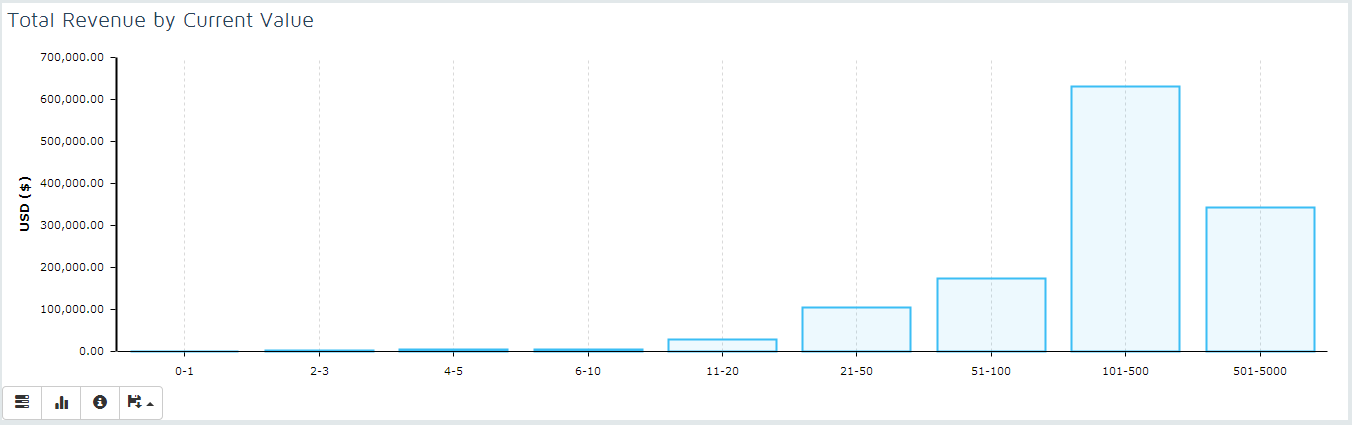
- Select monetisation/player current value
By looking at total revenue by player current value we can see that users with a lifetime value of between $101 and $500 are the players that are spending the majority of the money in this acquisition channel.
Acquisition Channel 2(AC2)
Selecting AC2 in the Select acquisition channel.
- Select monetisation/revenue
The revenue in AC2 is higher with a total revenue of $54,835 and an average revenue per user of $0.92
- Select monetisation/current player value
By looking at revenue by current player value we can see that users with a lifetime value of between $101 and $500 are the players that are spending the major of the money in this acquisition channel.
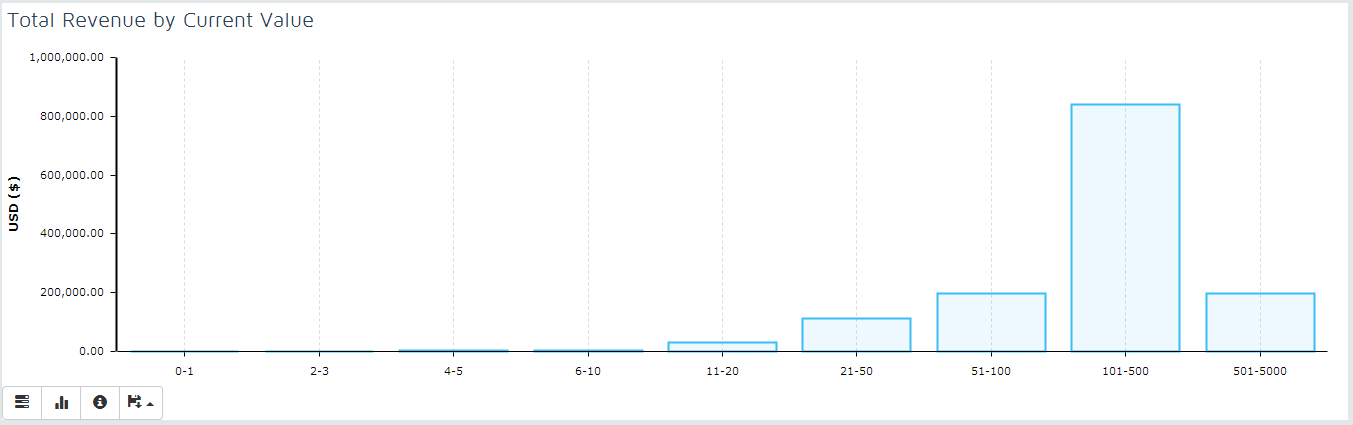
Even from this simple analysis it is clear that Acquisition Channel 2 is driving a higher revenue through a larger number of high value individuals that are generating a greater ARPU. These users appear to be strong repeat payers and this acquisition channel is obviously a valuable source of player acquisition.
Acquisition channel 1 on the other hand has delivered a small number of high value players that individually drive substantial revenue.

